BigCommerce's built-in analytics doesn't support custom reports. You can't filter by SKU and time period simultaneously, pull COGS by month, or build a report that combines order status with product keyword - not without exporting to a spreadsheet and building it yourself.
This is one of the most common frustrations raised in BigCommerce merchant communities, and the workarounds (manual CSV exports, Google Sheets formulas, waiting on a developer) are slow, error-prone, and don't update automatically.
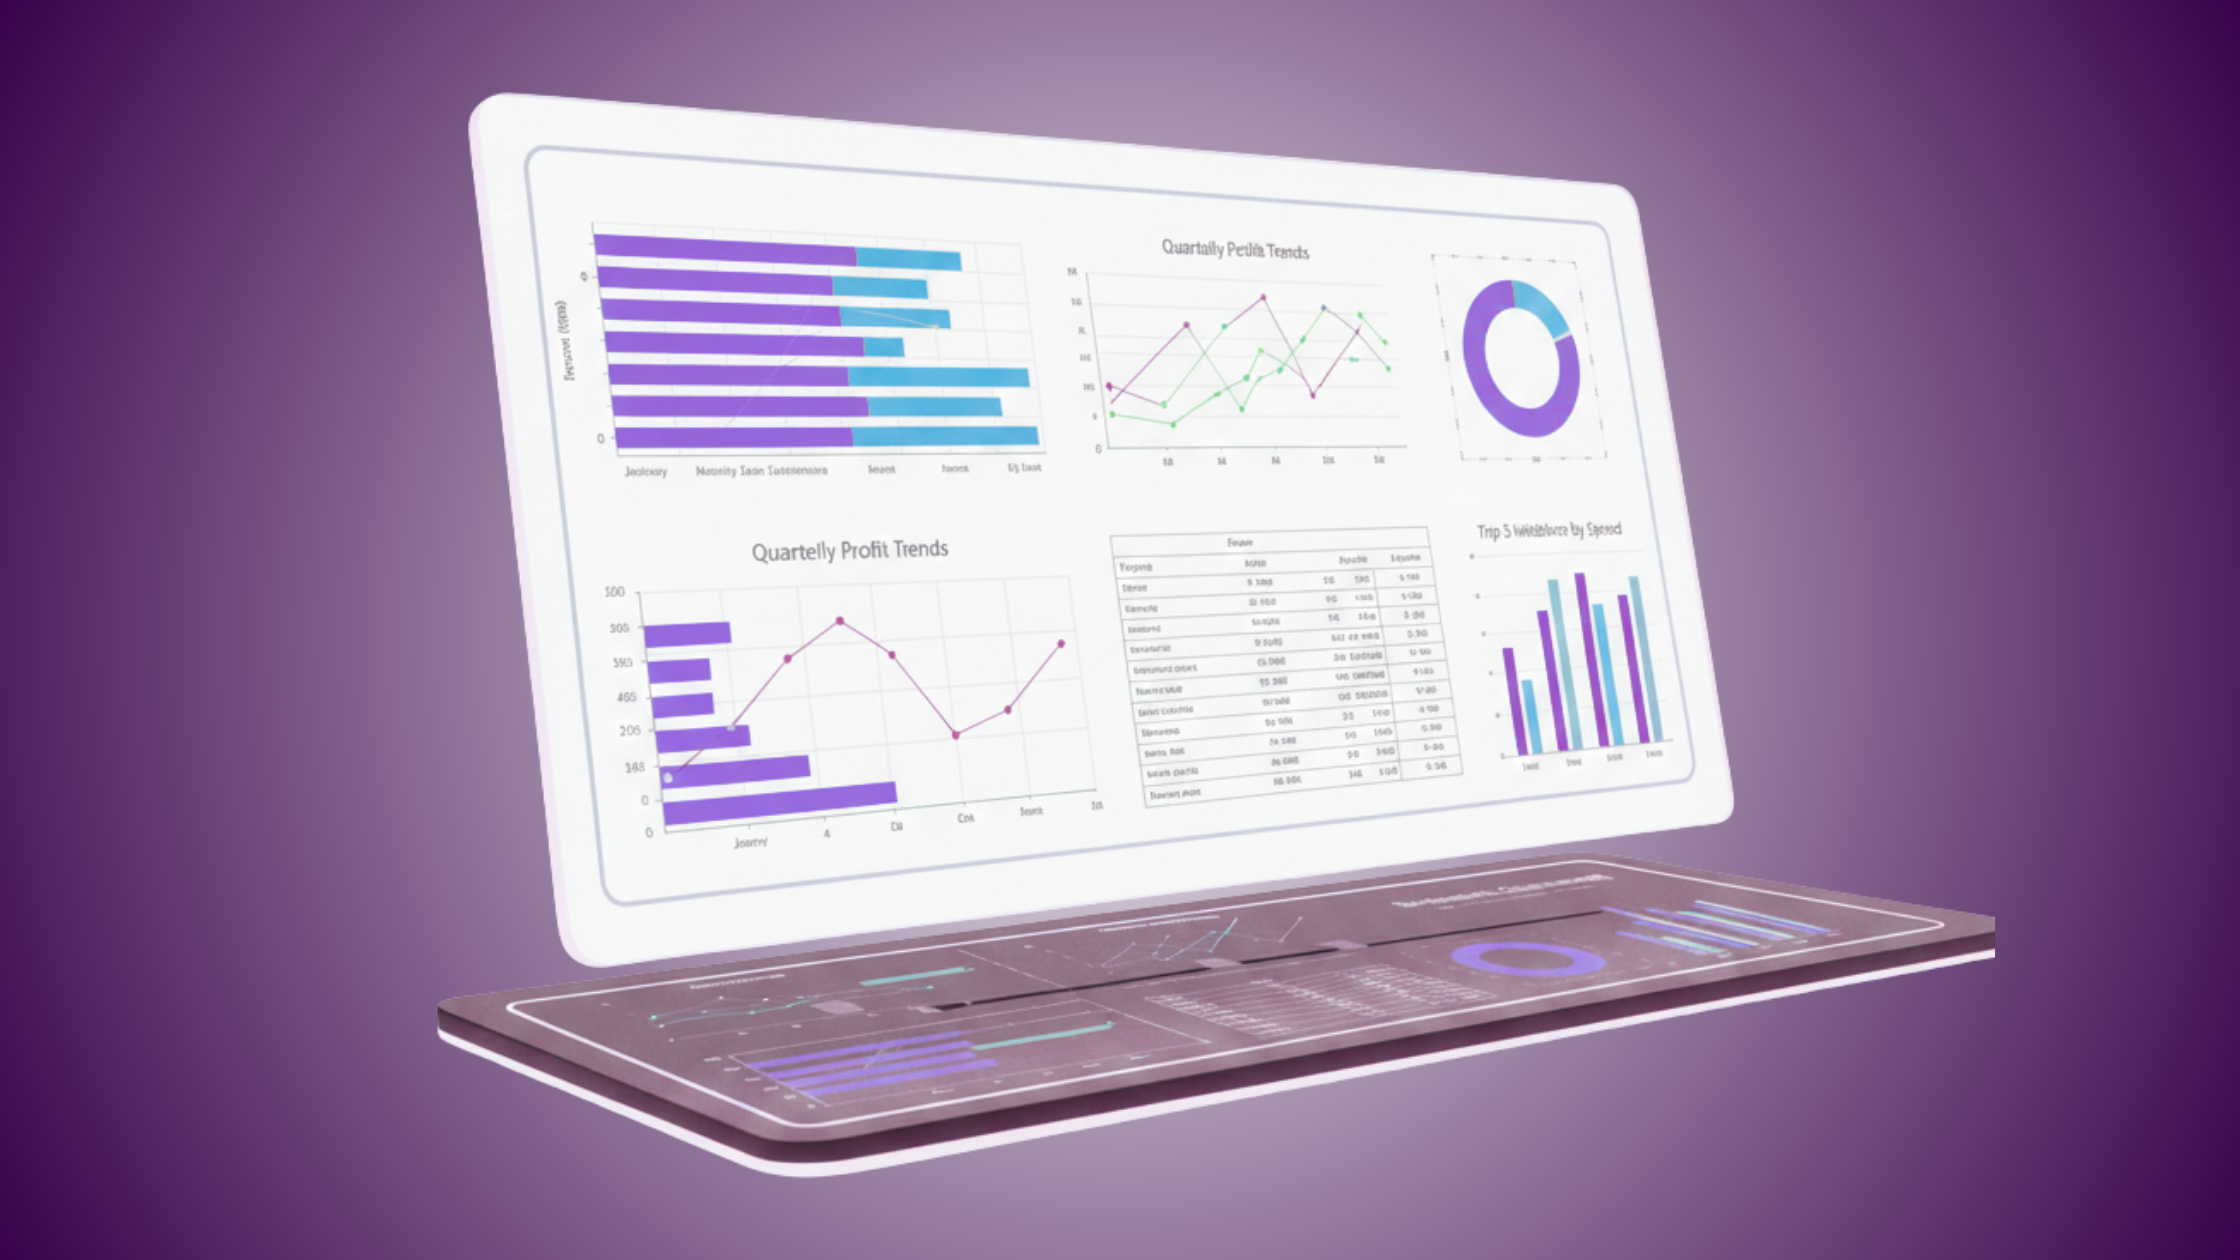
The good news: every reporting gap listed below can be solved in under two minutes using Chartsy's BigCommerce analytics - just ask in plain English, no SQL, no spreadsheets, no rebuilding the same report every month.
What BigCommerce's built-in reporting actually covers
Before getting into the gaps, it's worth being precise about what BigCommerce does well natively. The default analytics suite handles:
- Store overview: Total revenue, orders, and conversion rate over a date range
- Marketing reports: Traffic sources, campaign performance, and referral data
- Merchandising reports: Top products by revenue and order count
- Customer reports: New vs returning customers at a high level
- Finance reports: Tax summaries and basic transaction records
These reports are useful for high-level monitoring. They are not built for operational decision-making - the specific, drill-down questions that store owners actually need answered day to day.
The 6 most common BigCommerce reporting gaps - and how to solve each one
1. Quantity sold by SKU, broken down by time period
What merchants ask in support forums:
"I want to see quantity sold for a specific SKU grouped by quarter, month, week, or day. I can't find a way to do this in BigCommerce."
This is a foundational inventory and merchandising question. Knowing that SKU ABC-123 sold 47 units in March and 12 in April is the difference between a good reorder decision and a stockout.
BigCommerce's merchandising reports show totals across date ranges but don't let you drill down by individual SKU across a custom time breakdown.
How to solve it:
Ask Chartsy:
Show total quantity sold grouped by month for SKU = 'ABC-123'. Use the last 12 months.
The report is generated automatically and saved to your dashboard. Every time your order data updates, the report updates with it - no manual rebuild required.
2. Orders filtered by status and product keyword simultaneously
What merchants ask:
"I need a report showing orders with status 'Awaiting Fulfillment' that contain a specific product, with a count of how many times that product has been ordered."
Combining two filters - order status and product name - is not something BigCommerce's standard reports support. The only native workaround is exporting all orders and filtering manually in a spreadsheet.
How to solve it:
Ask Chartsy:
Show me a report of orders with status 'Awaiting Fulfillment' that contain products matching the keyword '[PRODUCT NAME]'. Group by product and show total quantity ordered.
The report is built instantly. Fulfillment teams can use a saved version of this report daily without touching a spreadsheet.
3. Cost of Goods Sold by month with gross profit
What merchants ask:
"I know my total monthly sales, but I can't find a way to see Cost of Goods Sold by month. I also want to know how each product category performed."
COGS tracking is one of the most requested missing features in BigCommerce analytics communities. Without it, you know your revenue but not your margin - which means you don't actually know how profitable your store is at a product level.
BigCommerce stores COGS data at the product level (if you've entered it), but the native reports don't surface it in a usable month-by-month format.
How to solve it:
For COGS and gross profit by month, ask Chartsy:
Create a monthly report showing Total Sales, Total Cost of Goods Sold, and Gross Profit (Sales minus COGS). Group by month.
For category-level performance, ask:
Show total sales by product category for the last 6 months. Group by category and sort from highest to lowest.
Both reports save to your dashboard and refresh automatically.
4. SKU-level quantity analysis without revenue figures
What merchants ask:
"I need to analyse individual product sales - SKU with quantities, not monetary values - within a month-to-month breakdown. What report can I use?"
Inventory and fulfillment teams often need unit counts rather than revenue figures. How many units of each SKU shipped this month? Which SKUs are moving fastest? BigCommerce reports tend to emphasise revenue over unit counts, which creates a gap for operations-focused reporting.
How to solve it:
Ask Chartsy:
Create a monthly summary where each row is SKU and month, showing total quantity sold. No revenue, just unit counts.
Clean, quantity-focused output - segmented by SKU and time period, saved and ready whenever it's needed.
5. Customer segmentation by purchase behaviour
What merchants ask:
"How do I see which customers have ordered more than X times, or spent more than $Y? I want to understand who my best customers actually are."
BigCommerce's customer reports give you new vs returning splits, but they don't let you slice your customer base by purchase frequency, total spend, average order value, or last purchase date. This makes loyalty and retention decisions harder than they need to be.
How to solve it:
Ask Chartsy:
Show me all customers with more than 5 orders in the last 12 months. Include total revenue, average order value, and last order date. Sort by total revenue.
Or for churn risk identification:
Which customers placed orders 3–6 months ago but haven't ordered since? Show their total historical spend.
These are the reports that turn customer data into retention decisions.
6. Fully custom report structures
What merchants ask:
"How can I customise reports or at least get detailed breakdowns of my sales data?"
This is the most common frustration - not a specific gap, but a general feeling that the available reporting doesn't match the decisions that need to be made. Every store is different: different product structures, different fulfillment workflows, different KPIs.
How to solve it:
Describe what you need in plain English. Examples of what you can ask:
- "Show me total revenue and order count by customer, for customers with more than 5 orders in the last 6 months."
- "Which products have the highest return rate? Show return count and return rate by SKU."
- "Compare total sales this month vs the same month last year, grouped by category."
- "Which SKUs have been in 'Awaiting Fulfillment' status for more than 7 days? Show order count and total value."
Every report you create saves to your dashboard and updates automatically as new orders come in.
Why BigCommerce's reporting has these gaps
Understanding why the gaps exist helps you work with them more effectively.
BigCommerce's analytics is designed for the broadest possible merchant audience - from a store with 10 products to one with 10,000. That means the native tools are optimised for general overviews rather than specific operational questions. The reports that 80% of merchants need 80% of the time are covered well. The specific, business-critical questions that grow in number as a store scales are not.
This isn't a flaw in BigCommerce as a platform. It's a predictable product decision. The gap it creates - between what the built-in tools can answer and what a growing store needs to know - is exactly where a dedicated reporting tool earns its keep.
BigCommerce native reports vs Chartsy: what each covers
| Reporting need | BigCommerce native | Chartsy |
|---|---|---|
| High-level revenue overview | Yes | Yes |
| SKU quantity by time period | Not supported | Fully supported |
| Filter by order status + product keyword | Not supported | Supported |
| COGS by month with gross profit | Not supported | Supported |
| Category sales breakdown | Basic totals only | Detailed, filterable |
| Customer segmentation by spend or frequency | Not supported | Supported |
| Fully custom report structure | Not available | Available via plain English |
| Reports that refresh automatically | Built-in reports only | All custom reports |
| Ask questions in plain English | Not available | Core feature |
How to get started without rebuilding everything
If your store has outgrown what BigCommerce's built-in reports can answer, the practical path forward is to identify the two or three questions you can't currently answer - and solve those first.
The most common starting points:
- COGS and gross profit by month - if you're making pricing or inventory decisions without this, you're working blind on margin
- SKU quantity sold by period - essential for reorder planning and seasonal trend identification
- Customer segments by purchase behaviour - the foundation of any retention or loyalty strategy. See our full guide on BigCommerce customer segmentation for more on this.
Each of these takes less than two minutes to set up in Chartsy, and once saved, they update automatically every time new orders come in.
Set up Chartsy for your BigCommerce store →
Frequently asked questions
Can BigCommerce generate custom reports?
BigCommerce does not natively support fully custom reports. Its built-in analytics covers high-level overviews - revenue totals, top products, traffic sources - but doesn't let merchants define custom filters, combine multiple dimensions (like order status and product keyword), or build reports that refresh automatically. For custom reporting, most merchants use a third-party analytics tool that connects to their BigCommerce store via API.
How do I see quantity sold per SKU in BigCommerce?
BigCommerce's merchandising reports show top products by revenue and order count but don't provide a clean SKU-by-SKU quantity breakdown across custom time periods. To get quantity sold per SKU by month, week, or day, you need either a manual CSV export and spreadsheet analysis, or a connected analytics platform like Chartsy where you can ask for the report in plain English and have it refresh automatically.
Does BigCommerce track Cost of Goods Sold?
BigCommerce stores COGS data at the product level if you enter it in your product settings, but its native reports don't surface COGS in a month-by-month format or calculate gross profit automatically. To get a monthly COGS and gross profit report without manual spreadsheet work, you need a third-party analytics tool connected to your store data.
What is the best analytics tool for BigCommerce custom reports?
For merchants who want to create custom reports by describing what they need in plain English - without SQL, spreadsheets, or developer help - Chartsy is purpose-built for this use case. It connects directly to BigCommerce via API, supports COGS tracking, SKU-level analysis, customer segmentation, and fully custom report structures, and all reports update automatically as new orders come in.
Why did my BigCommerce analytics traffic drop?
Ranking drops on analytics-related content are typically caused by one of four things: content that's too thin relative to what now ranks (under 800 words struggles against 1,500+ word competitors), missing FAQ sections that capture People Also Ask placements, lack of E-E-A-T signals like author attribution and external citations, or the growth of AI Overviews pushing organic results further down the page. Refreshing the content with more depth, a FAQ section, and stronger keyword signals in the title and introduction usually recovers lost impressions.
Can I filter BigCommerce orders by product and status at the same time?
Not natively. BigCommerce's order reports allow filtering by status or by date range, but not by a combination of status and product keyword simultaneously. This is one of the most frequently requested features in BigCommerce merchant communities. The workaround without a third-party tool is a manual export to spreadsheet with filtering applied there - which doesn't update automatically and has to be repeated each time.
Written by the Chartsy analytics team. Chartsy is a BigCommerce analytics platform that lets store owners create custom reports by describing what they need in plain English - no code, no spreadsheets, no waiting.