The Chartsy Blog
Explore SaaS and BigCommerce analytics tips, integration guides, and no-code visualization insights. Unlock growth with our strategies!
All Articles
SaaS Churn Rate Benchmarks: What's Good, What's Bad, What's Fatal
Churn benchmarks vary significantly by ARR stage, customer segment, and pricing model. Here's what the numbers actually look like across the industry - and how to interpret where yours stands.
Introducing Chartsy's MRR Breakdown Dashboard
A guided look at where your subscription revenue comes from - and what's changing. The new MRR Breakdown dashboard surfaces current MRR, movement trends, plan-level splits, and top customers in one clear, narrative-driven view.
How an MRR Dashboard Helps You Make Better Decisions Every Day
When your MRR, plan breakdown, movements, and top customers are in one place, the decision you need to make each morning becomes obvious. Here's how a complete MRR dashboard changes the way you run your subscription business.
Stripe Metadata: What to Track, How to Set It Up, and Why It Changes Your Analytics
Most SaaS founders use Stripe metadata inconsistently or not at all - and miss out on the most powerful segmentation layer in their business. Here's a practical guide to what to track, how to set it up, and what you can do with it once it's there.
Chartsy MRR Dashboard vs ProfitWell: Which Gives You Answers?
Chartsy's MRR dashboard gives guided answers. ProfitWell gives deep analytics. Both track subscription revenue - but they're solving different problems. Here's how to choose.
Stripe MRR vs Chartsy Dashboard: Raw Data vs. Guided Insight
Stripe shows you payment data. Chartsy's MRR dashboard explains your subscription revenue - plan by plan, movement by movement. Here's the difference and why it matters.
What Is ARPU? Average Revenue Per User Explained
ARPU tells you how much revenue each customer generates on average. Learn how to calculate it, what drives it, and how to use it to make better pricing and segmentation decisions.
What Is ARR? Annual Recurring Revenue Explained
ARR is how SaaS businesses measure revenue at scale. Learn what ARR is, how to calculate it, when to use it over MRR, and what it means for your business valuation.
What Is Churn Rate? How to Calculate and Reduce It
Churn rate is the percentage of customers or revenue you lose each month. Learn how to calculate it, why it compounds against you, and the most effective ways to reduce it.
What Is CAC? Customer Acquisition Cost Explained
CAC tells you what it costs to win each new customer. Learn how to calculate it correctly, what a healthy CAC looks like, and how to bring it down without cutting growth.
What Is Customer Lifetime Value (LTV)? Formula, Benchmarks, and How to Improve It
LTV tells you how much revenue a customer generates over their entire relationship with your business. Learn how to calculate it, why it drives every growth decision, and how to increase it.
What Is Expansion MRR? The Growth Engine Inside Your Existing Customer Base
Expansion MRR is the revenue you generate from existing customers upgrading, adding seats, or buying add-ons. It's the most capital-efficient growth lever in SaaS - and most businesses underuse it.
What Is MRR Growth Rate? How to Measure and Sustain SaaS Growth
MRR growth rate tells you how fast your subscription revenue is compounding month over month. Learn how to calculate it, what drives it, and what a healthy rate looks like at each stage.
What Is MRR? Monthly Recurring Revenue Explained
MRR is the single most important number in any subscription business. Learn what it is, how to calculate it correctly, why it matters, and how to grow it.
What Is Net Revenue Retention (NRR)? The Metric That Predicts Long-Term Growth
NRR measures how much revenue you retain and grow from existing customers. A number above 100% means your business grows even without acquiring a single new customer.
What Is the SaaS Quick Ratio? Measuring Growth Efficiency
The SaaS Quick Ratio measures how efficiently your business grows - balancing new and expansion revenue against churn and contraction. A ratio above 4 signals healthy, sustainable growth.
What Is Trial-to-Paid Conversion Rate? How to Calculate and Improve It
Trial-to-paid conversion rate measures how many free trial users become paying customers. It's one of the highest-leverage metrics in SaaS - improving it grows revenue without increasing traffic.
Turn Your Stripe Metadata Into Business Intelligence
You've been tagging customers and subscriptions in Stripe for years. Here's how to finally use that data for real analysis - without a spreadsheet in sight.
Stripe vs Paddle: Which Payment Processor is Right for Your SaaS?
A detailed comparison of Stripe and Paddle on pricing, features, tax handling, and total cost of ownership - so you can choose the right payment processor for your SaaS business.

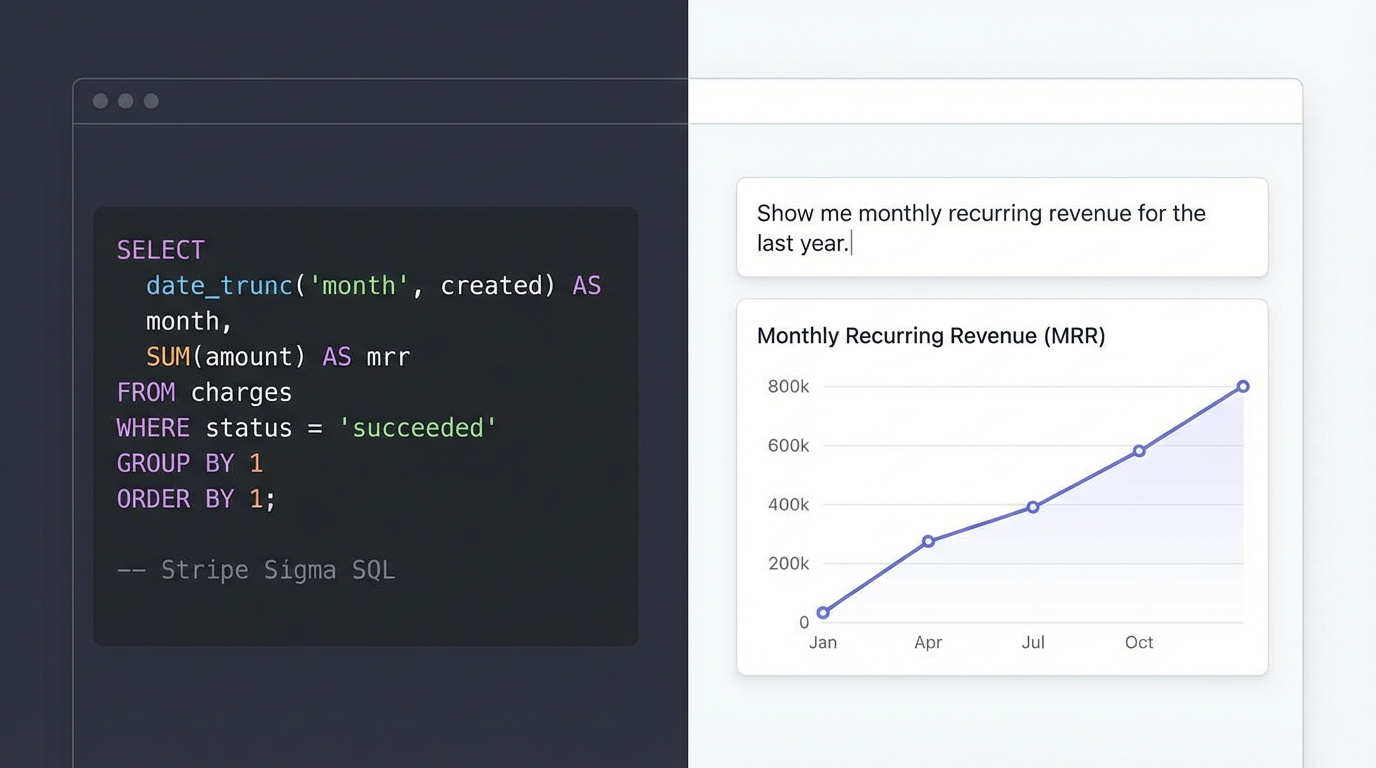
Chartsy vs Stripe Sigma: Which Is Right for Your Business?
Stripe Sigma gives analysts SQL access to your Stripe account. Chartsy gives everyone else instant answers. Here's how they compare and when to use each.
Best ProfitWell Alternatives in 2026: Subscription Analytics Tools Compared
Looking for a ProfitWell alternative? We compare the top subscription analytics platforms - Baremetrics, ChartMogul, Chartsy, and others - so you can find the right fit for your SaaS.
MRR Dashboard: How to Visualize Monthly Recurring Revenue (2026 Guide)
A complete guide to building an MRR dashboard for your SaaS business - what metrics to include, which tools to use, and how to go from raw Stripe or Paddle data to clear visual insights.
SaaS Pricing Calculator: How to Price Your Product Using Real Revenue Data
Learn how to calculate and optimize your SaaS pricing using actual subscription data - including formulas for ARPU, LTV, churn impact, and a step-by-step pricing model framework.
Stripe Analytics Dashboard: Build One Without a Developer (2026 Guide)
A step-by-step guide to building a custom Stripe analytics dashboard - tracking MRR, churn, LTV, and revenue trends - without SQL, exports, or a data team.
What Is Stripe Sigma? Features, Pricing & Limitations (2026)
A plain-English guide to Stripe Sigma: what it does, how much it costs, what SQL skills you need, and when a no-code alternative like Chartsy makes more sense.
Best Analytics Tools for SaaS Businesses Using Stripe or Paddle
Comparing the top analytics tools for SaaS businesses that run on Stripe or Paddle. Find out which platform gives you the clearest picture of MRR, churn, and revenue growth.
Best Ecommerce Analytics Tools for Online Store Owners
A practical comparison of the best ecommerce analytics tools available today. Learn which platforms help online store owners track sales, customers, and growth without the complexity.
What Is a Good Conversion Rate for a BigCommerce Store?
Wondering what counts as a good conversion rate for your BigCommerce store? Learn industry benchmarks, what affects your CVR, and how to improve it with the right analytics.
Stripe Sigma vs. Chartsy: Real Business Examples of How Teams Actually Use Them (2026)
Stripe Sigma is great for SQL-savvy analysts. Chartsy is built for founders and operators who want instant, visual answers from Stripe data without writing queries. Here's how both tools behave in real business scenarios.

How Chartsy Can Boost BigCommerce Sales in 2026
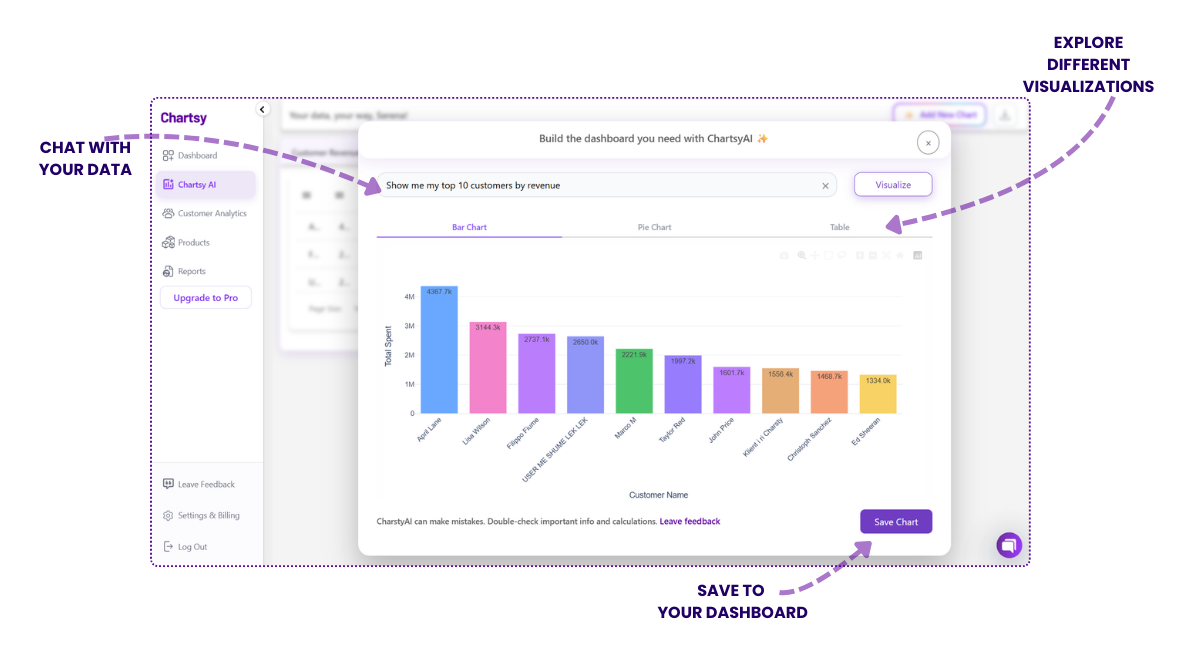
Boost BigCommerce sales in 2026 with ChartsyAI. Get actionable insights on products, customers, and revenue - no coding or developer needed.

How to Build a BigCommerce Dashboard Without Hiring a Developer (2025 Guide)
Learn how to create a BigCommerce analytics dashboard with ChartsyAI. Track sales, customers, products, and segments - no developer needed.

Why BigCommerce's Built-in Analytics Aren't Enough (And What to Do Instead)
BigCommerce's native analytics dashboard is fine for quick snapshots of revenue and orders — but it breaks down the moment you ask deeper questions about LTV, churn, or cohorts. Learn what's missing and what to use instead.
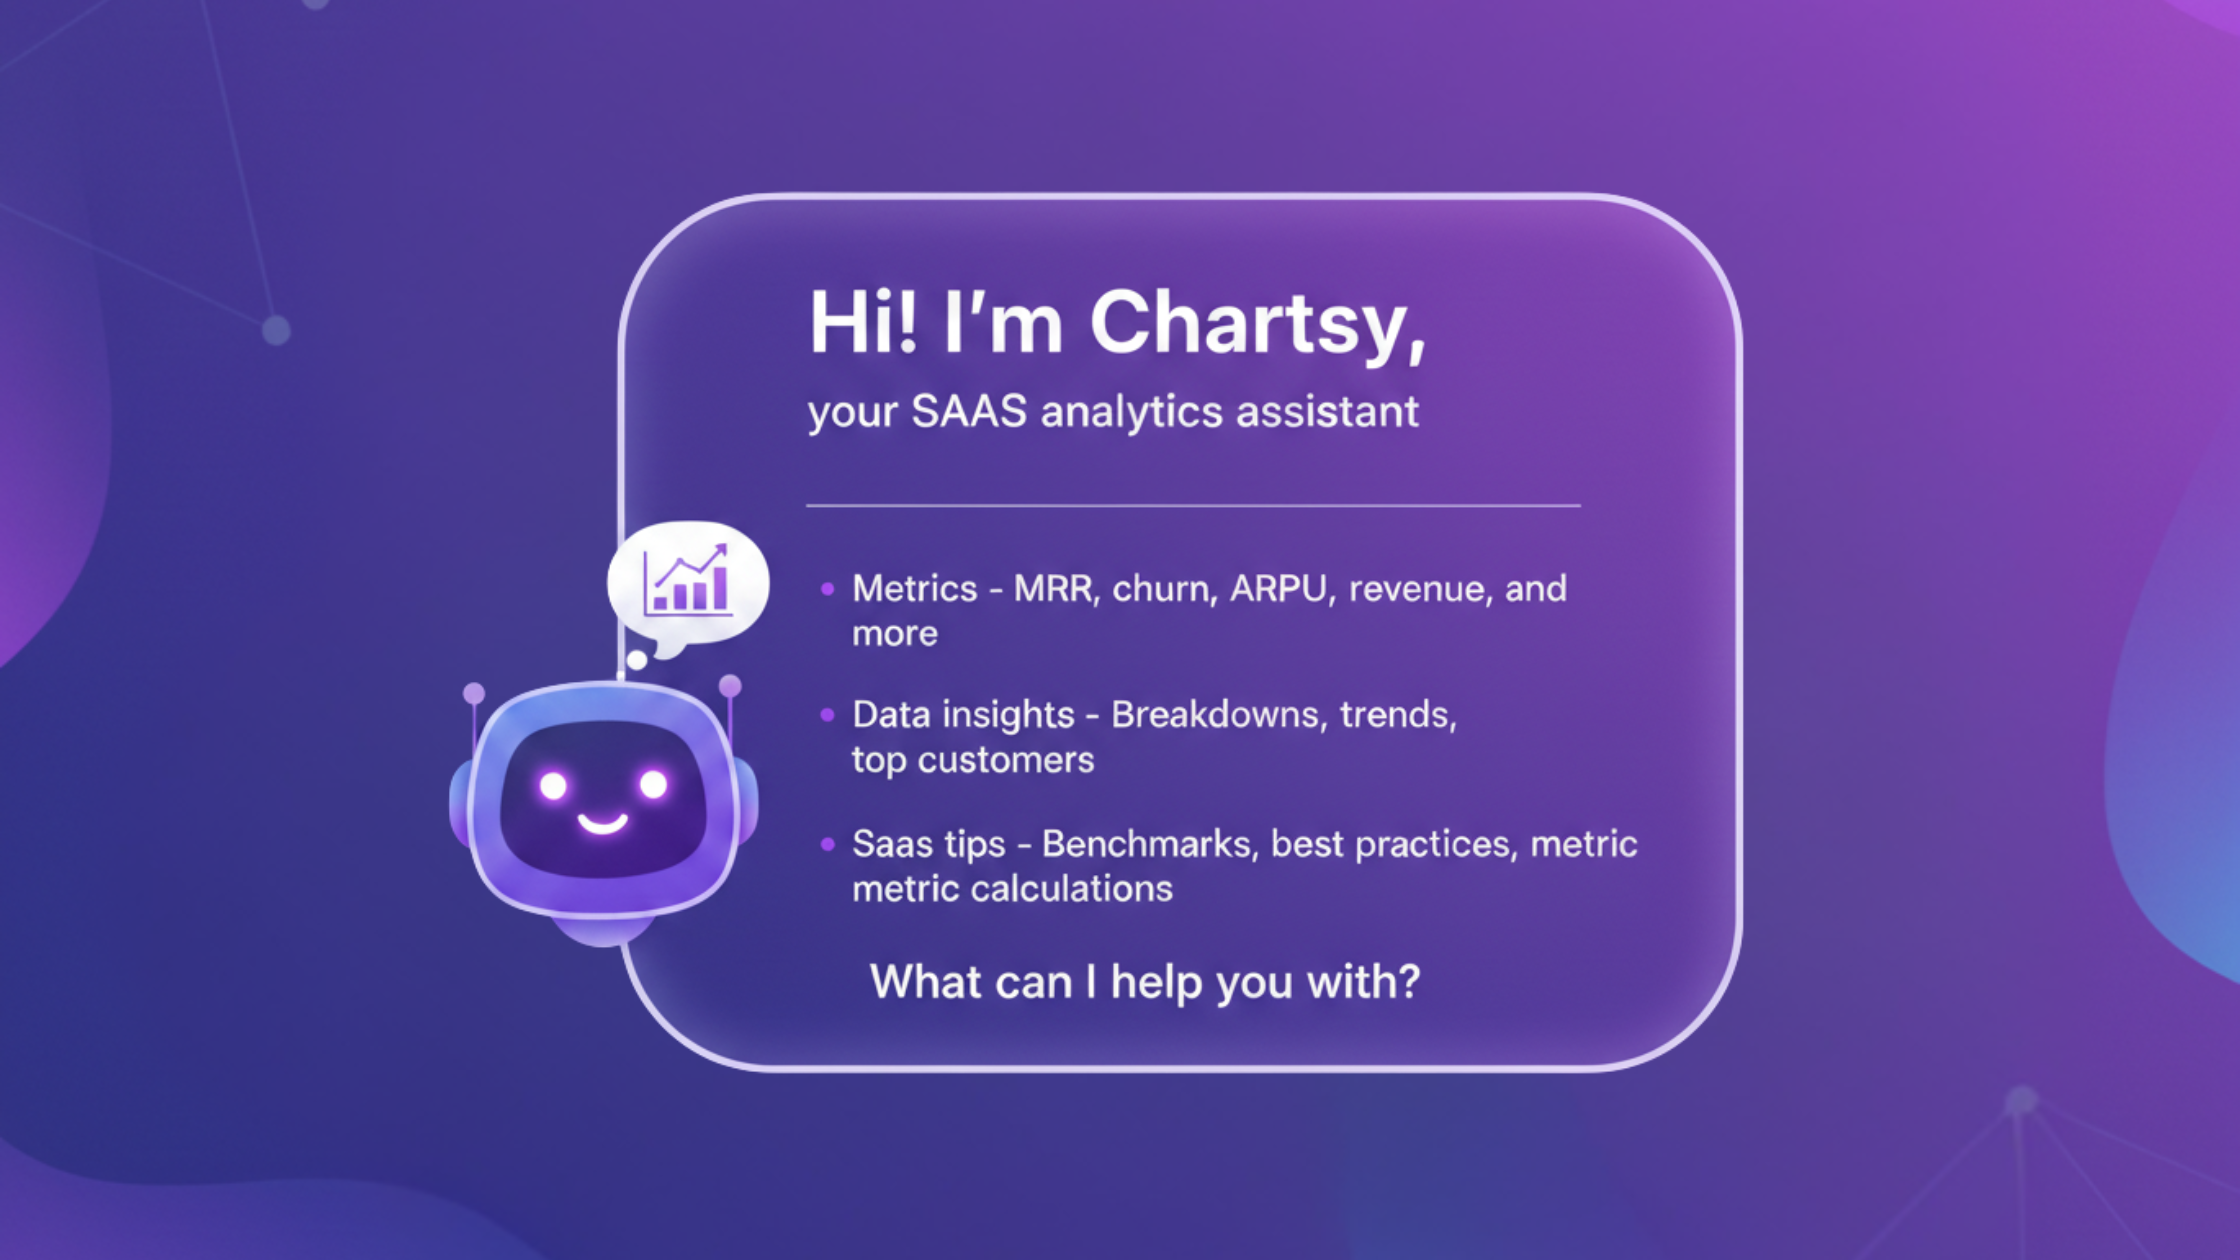
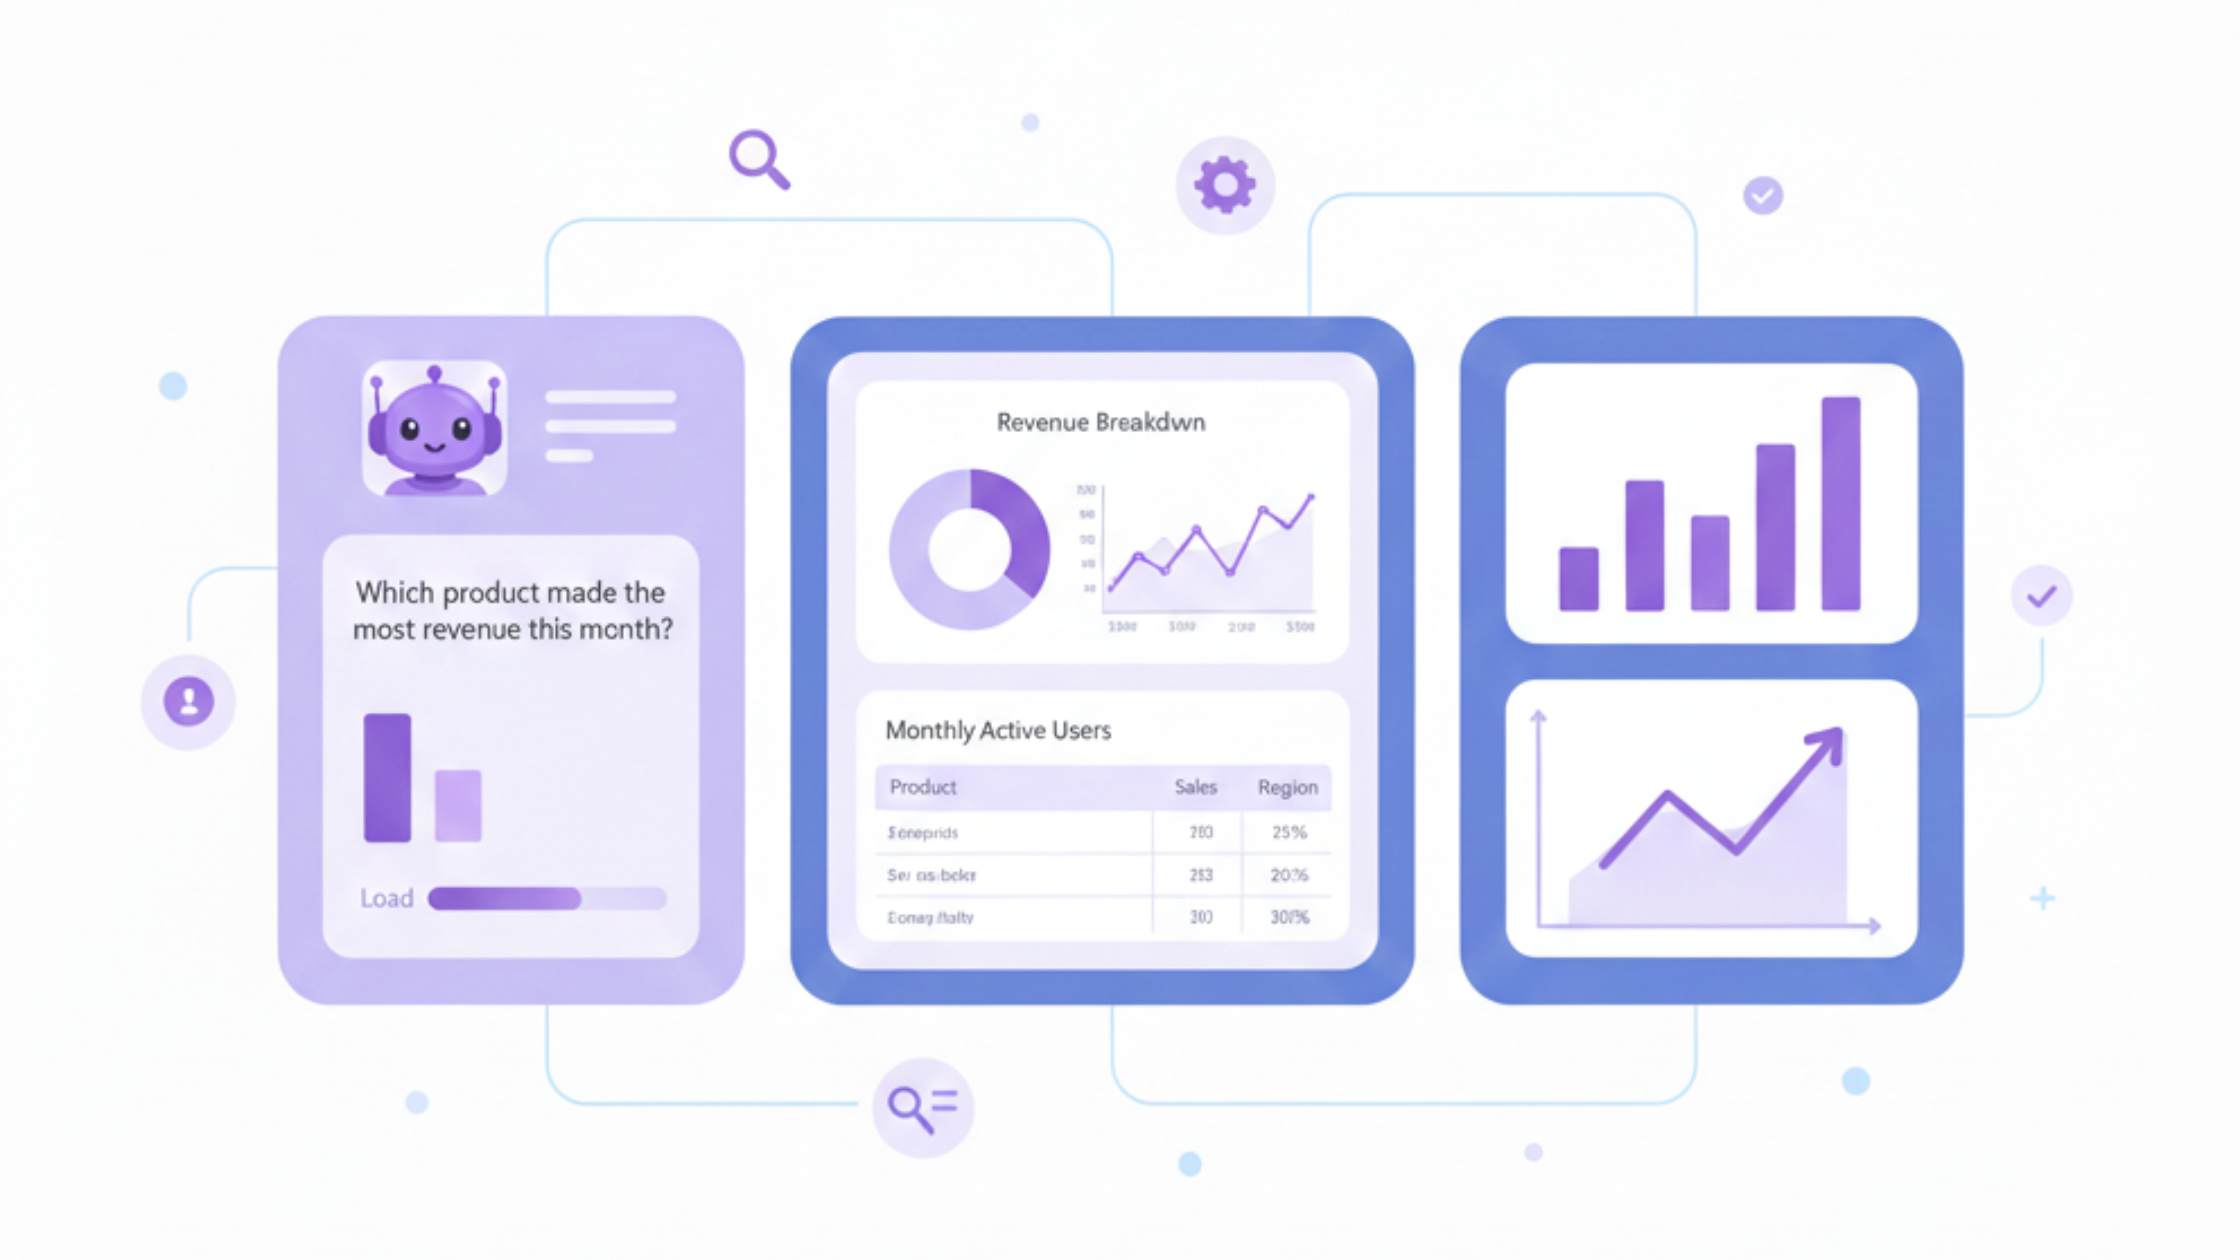
Meet Chartsy's New AI Chatbot for SaaS Data
Understanding your SaaS metrics just got a whole lot easier. Chartsy's new AI chatbot lets you explore your data in a simple, ChatGPT-style conversation — with clear explanations, real calculations, and instant visual insights.

Top 5 Best BigCommerce Apps to Grow Your Store in 2026
Scale revenue, improve retention, and understand your customers with the right tools. Discover the best BigCommerce apps for analytics, email marketing, reviews, subscriptions, and conversion optimization.

BigCommerce Custom Reports: How to Get the Data Your Store Actually Needs
BigCommerce's built-in reports can't answer most specific merchant questions - no SKU breakdowns, no COGS by month, no custom filters. Here's how to get exactly the reports you need, in plain English, without SQL or spreadsheets.
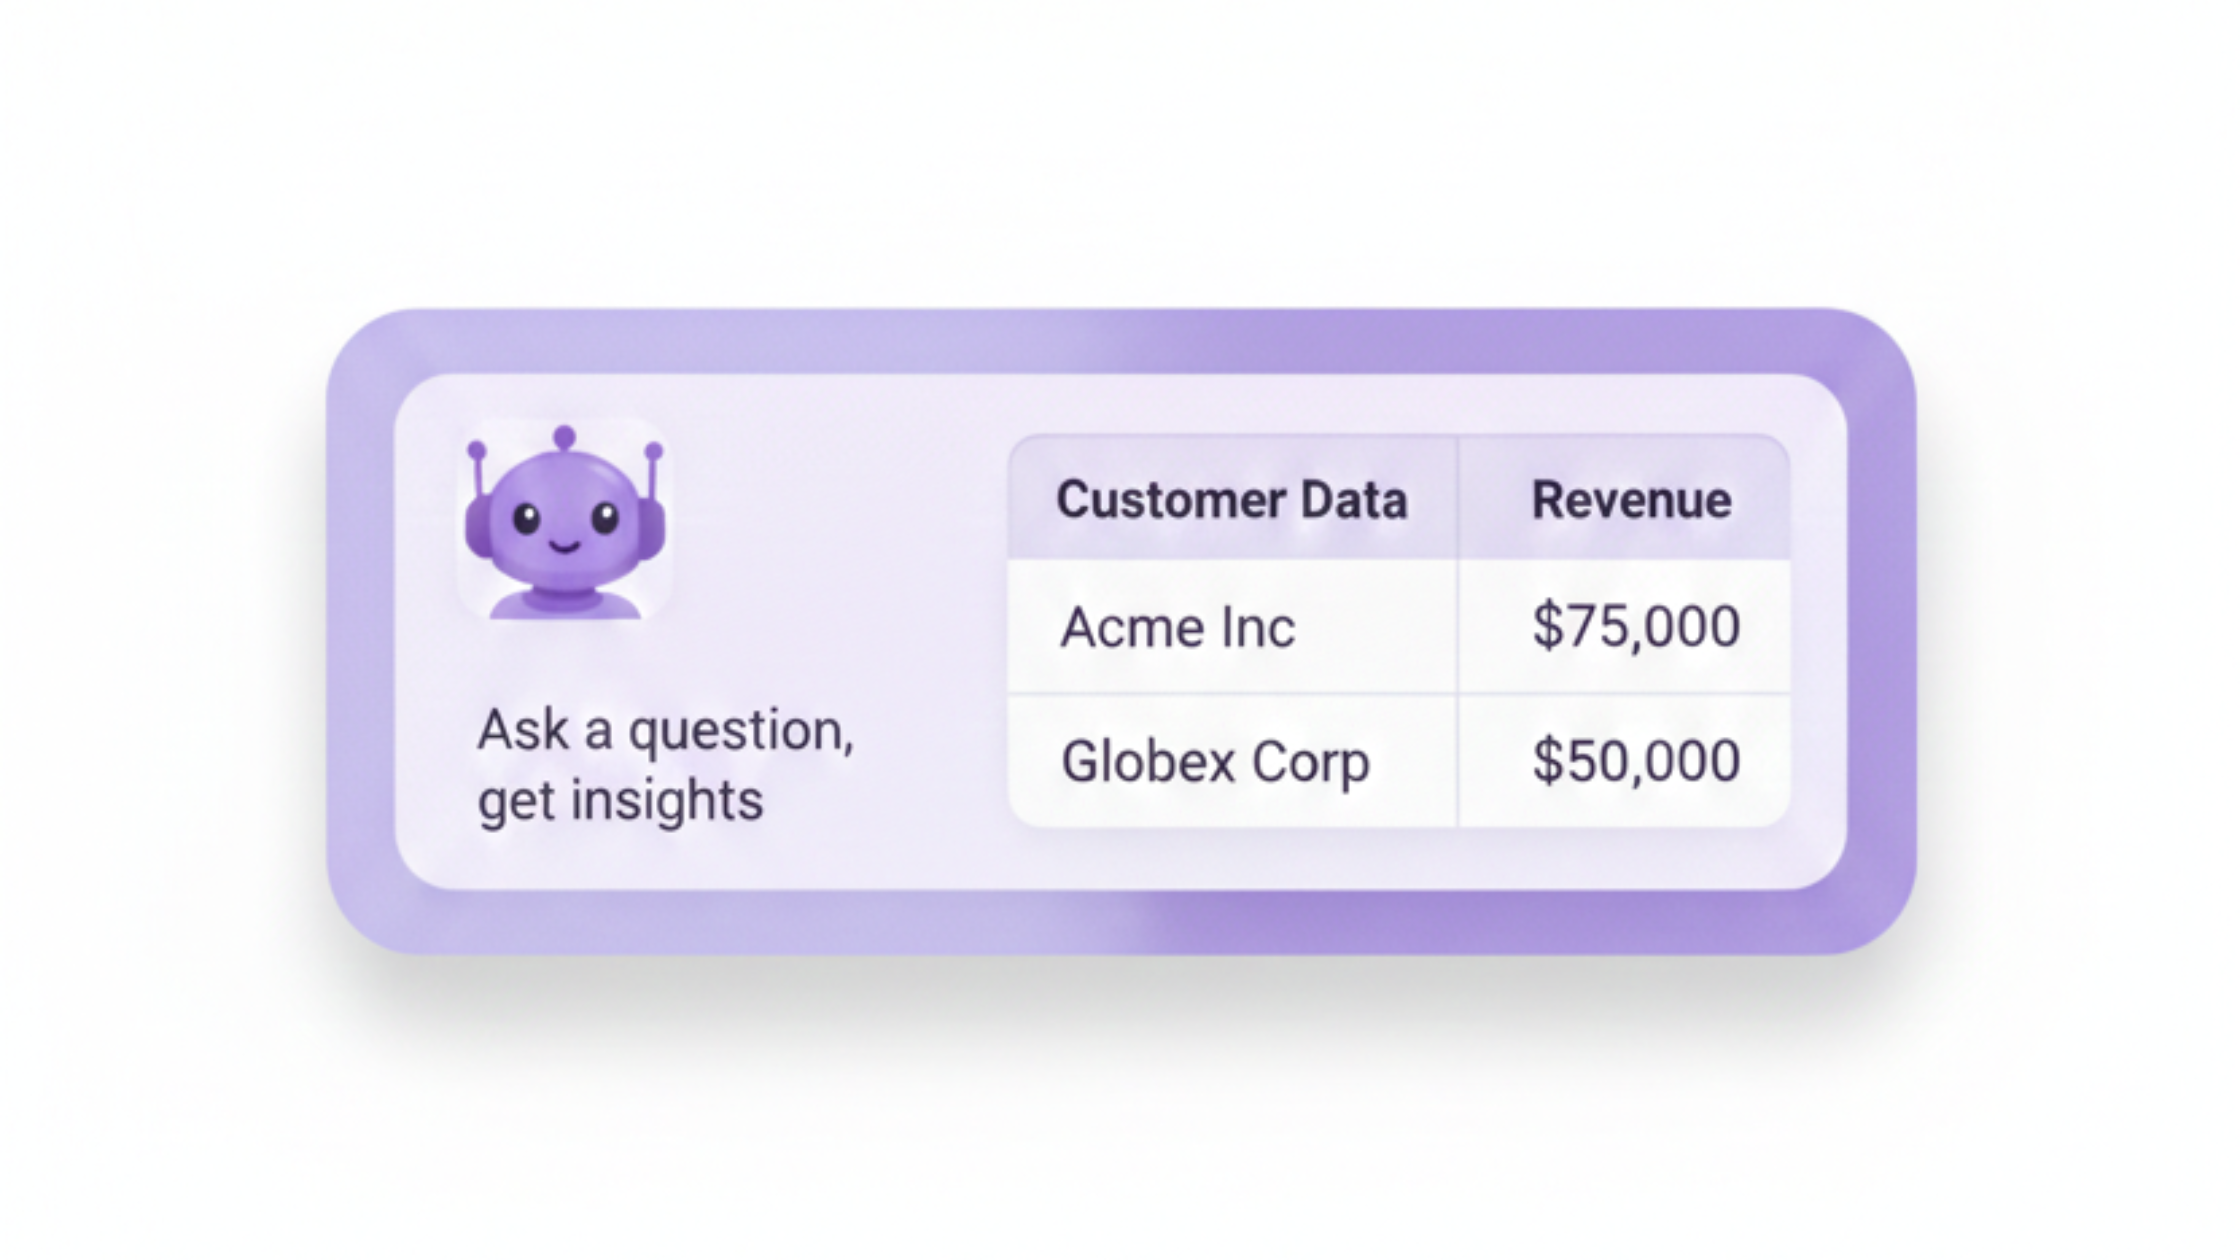
BigCommerce Customer Data and Reporting Made Simple with Chartsy
A BigCommerce store owner struggled to combine business names, billing addresses, and revenue into a single, usable report — until Chartsy turned scattered data into clear, actionable insights.
Chartsy vs Glew.io: A Smarter and More Flexible Alternative for BigCommerce Analytics
Choosing the right ecommerce analytics software can directly impact how quickly you make data-driven decisions. Compare AI-powered natural language reporting with Chartsy vs traditional dashboards with Glew.io.

10 Most Important Metrics Every Founder Should Track
Good decisions need good data. Learn the 10 key metrics every founder should track - MRR, ARR, churn, CLV, CAC, and more - and how to interpret them with subscription analytics software.

How Chartsy Calculates MRR (and Why It Might Look Different From Stripe)
MRR should be simple, but it often looks different across platforms. Learn what MRR is, why numbers differ, and how Chartsy calculates MRR for more reliable subscription analytics.
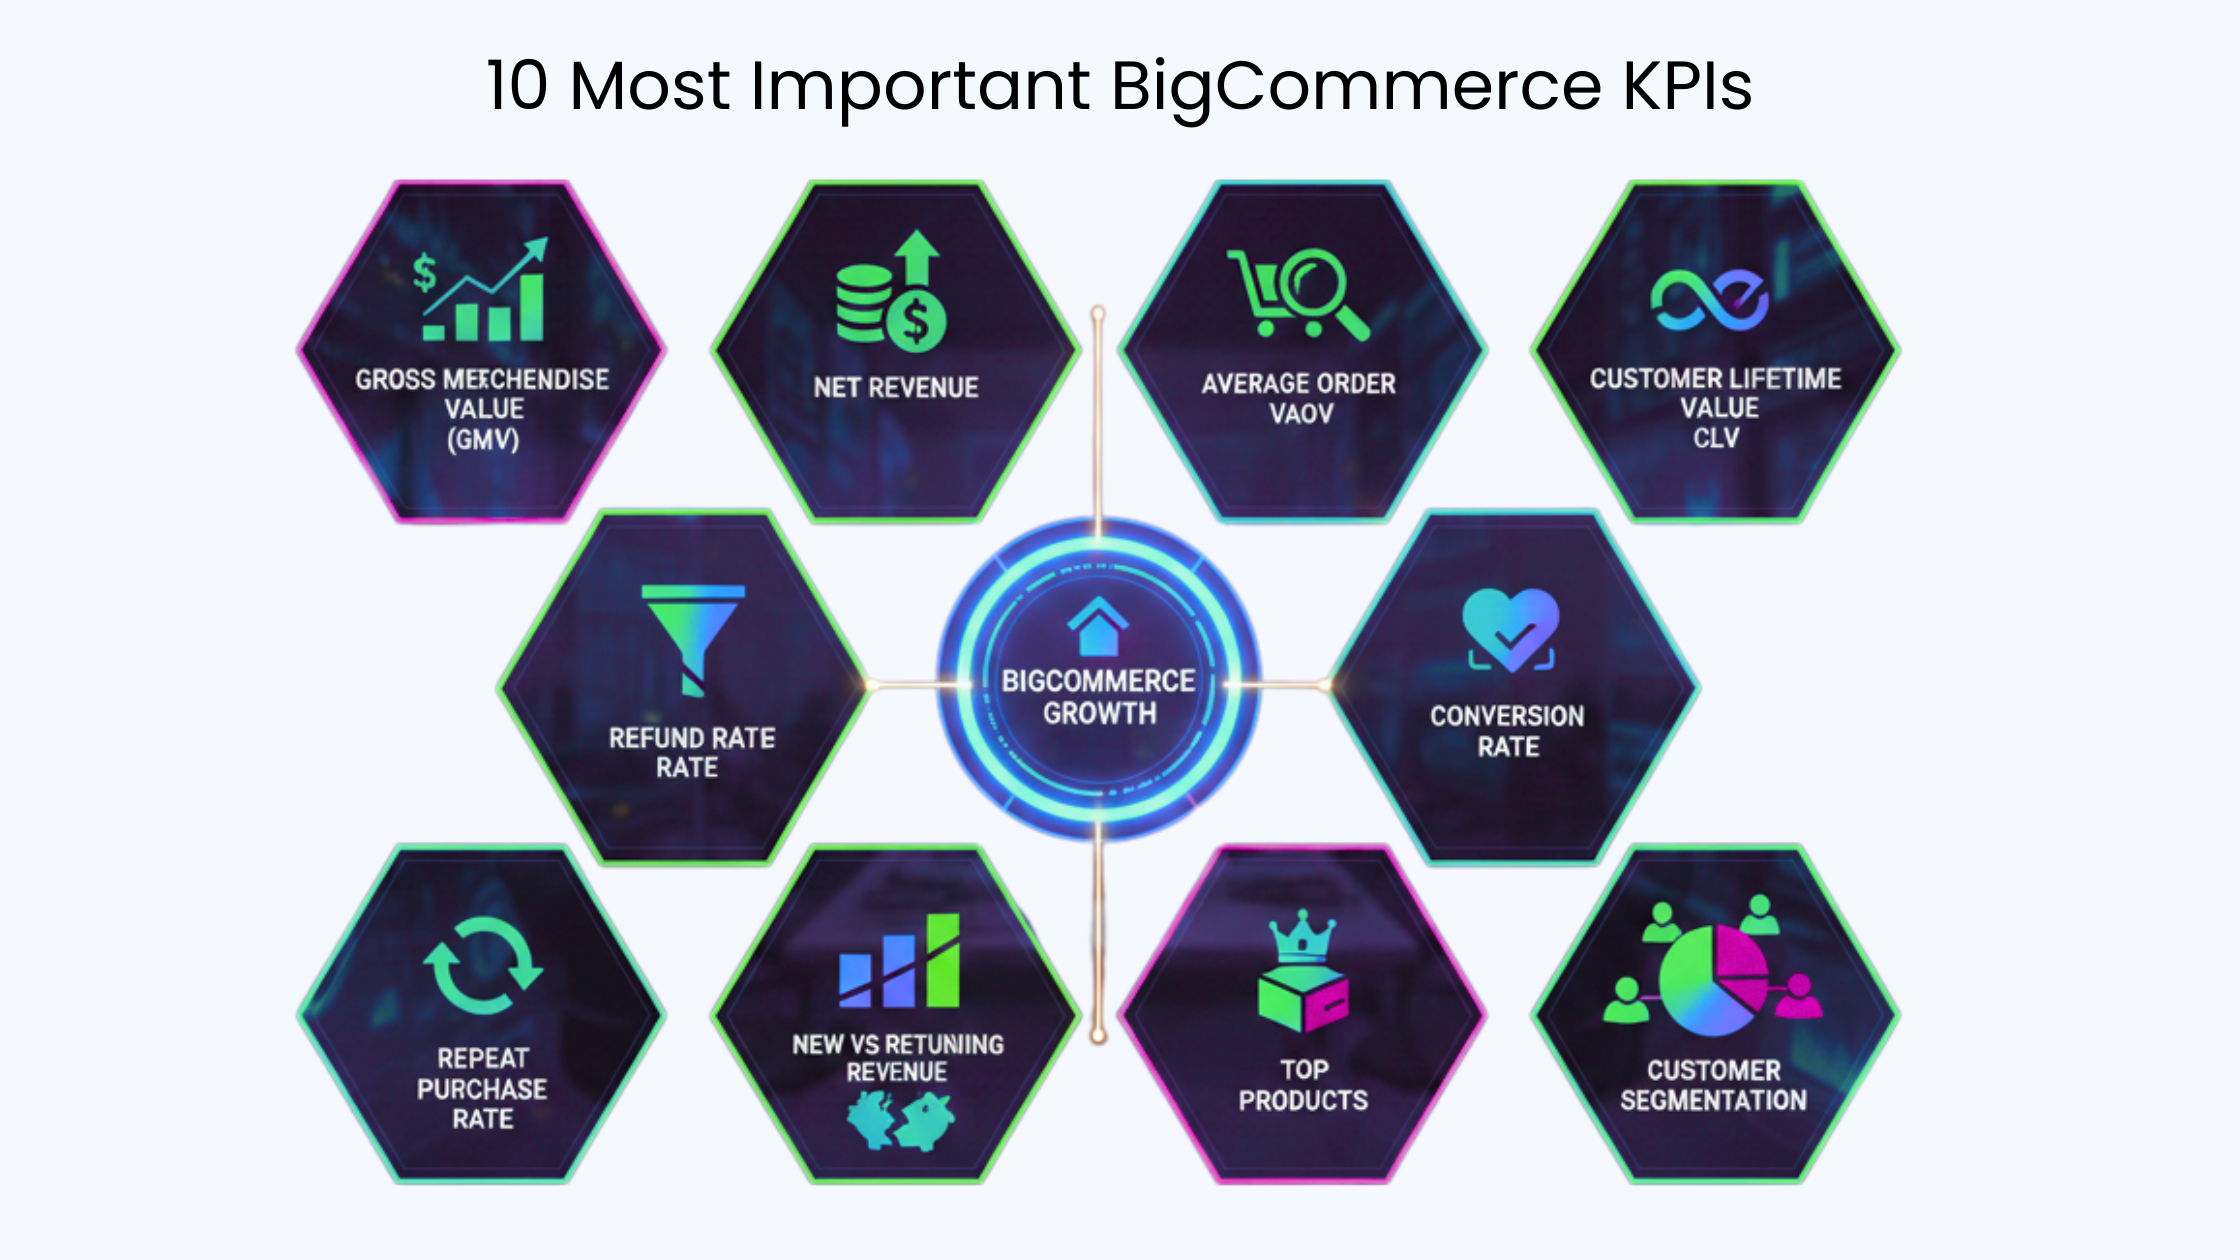
10 Most Important BigCommerce KPIs to Track for eCommerce Growth
Data alone doesn't drive growth. Learn the 10 essential BigCommerce KPIs every store should track - GMV, AOV, conversion rate, CLV, and more - for sustainable eCommerce growth.
Why Custom Charts Beat Pre-Built Dashboards in BigCommerce Analytics
Pre-built dashboards are fine for quick overviews, but growing BigCommerce stores need flexible, question-driven analytics. Learn why custom charts unlock deeper insights and smarter decisions.

BigCommerce Customer Segmentation: How to Understand Your Customers and Increase Revenue
Learn how to segment your BigCommerce customers using RFM analysis. Identify your best buyers, prevent churn, and increase revenue with actionable strategies and clear charts.

A Clear Path to Understanding SaaS Revenue Performance
Create a Revenue Performance Dashboard that reveals MRR trajectory, top-performing plans, and customer retention trends. Transform your Stripe and Paddle subscription data into actionable insights for your SaaS.
Chartsy vs ProfitWell: The Modern Alternative for Subscription Analytics
ProfitWell delivers clean SaaS dashboards, but Chartsy goes further — letting you ask any question about your Paddle or Stripe data and get an instant visual answer.

Why Most SaaS Dashboards Fail and How to Fix Them
Traditional SaaS dashboards overwhelm with generic metrics, leaving founders and operators searching for answers. Chartsy redefines analytics by letting you ask questions in plain English, delivering tailored insights instantly to drive growth.

Unlock Your SaaS Growth with Chartsy's Stripe Analytics Dashboard in 2025
Struggling to decode your Stripe data? Manual spreadsheets and complex SQL queries waste time and obscure insights. With Chartsy, you can transform your Stripe subscription, revenue, and customer data into powerful, no-code Stripe visualizations in seconds.