Understanding your SaaS metrics just got a whole lot easier. For years, founders and operators have been tethered to complex dashboards, custom SQL queries, and brittle spreadsheets just to answer basic questions about their business health.
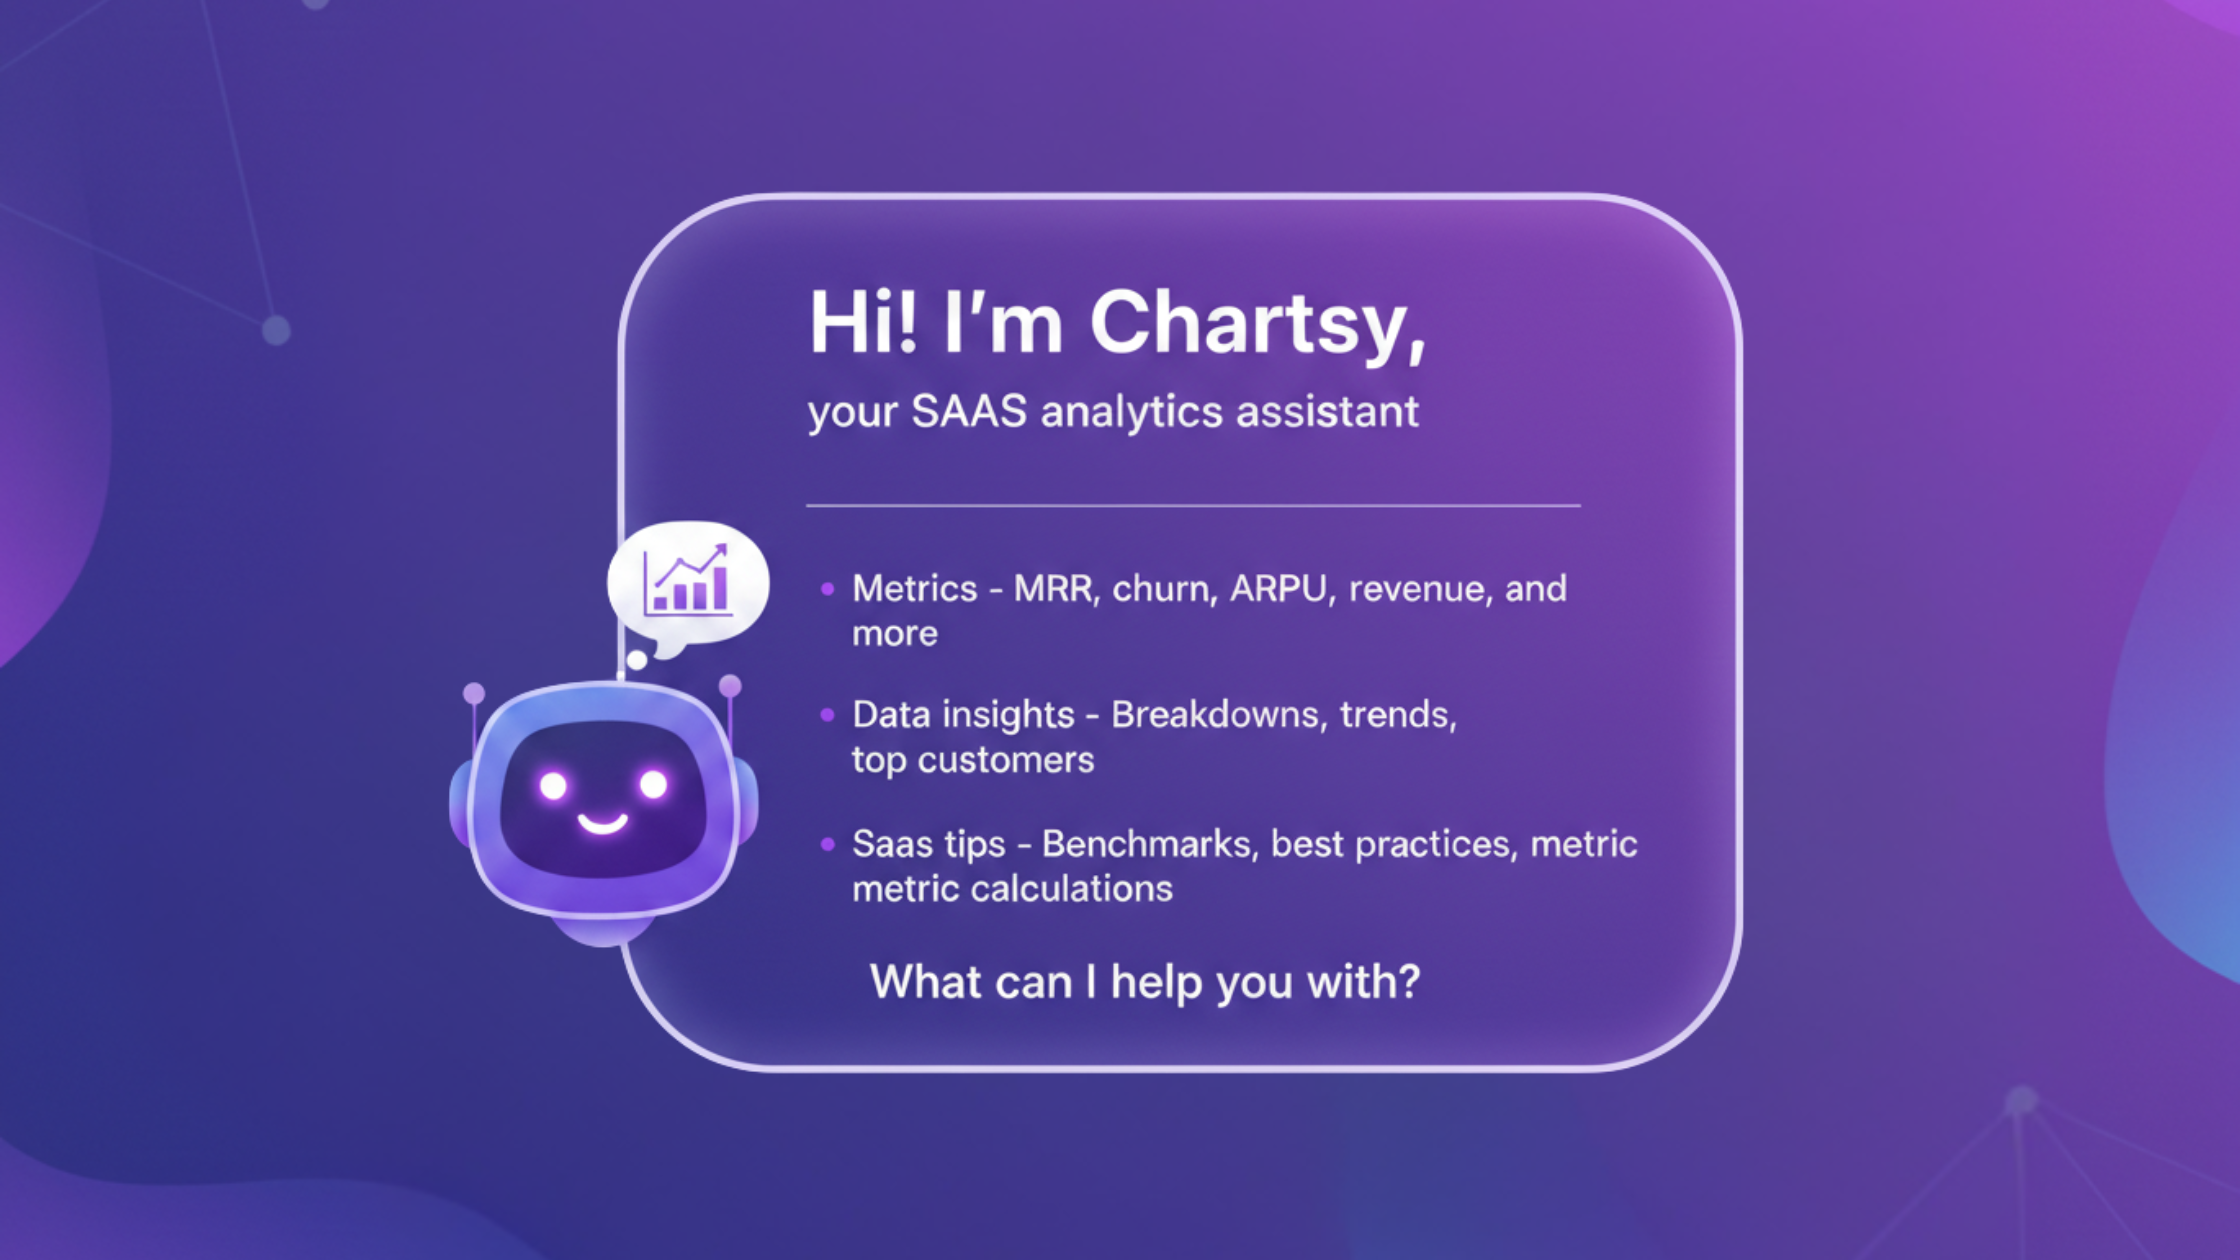
Today, we are changing that. Chartsy now includes a powerful AI chatbot for SaaS data that lets you explore your metrics in a simple, ChatGPT-style conversation-right inside your dashboard. Instead of hunting through reports or building filters from scratch, you can now talk to your data the same way you’d talk to a senior data analyst.
By leveraging natural language processing (NLP), Chartsy translates your plain-English questions into complex data queries, providing instant explanations, real-time calculations, and visual charts.
What is an AI Chatbot for SaaS Data?
An AI chatbot for SaaS data is a conversational interface that uses Large Language Models (LLMs) to connect directly to your subscription and billing data (like Stripe or Paddle). It allows users to ask questions such as "What is my current churn rate?" and receive an immediate, accurate answer without manual data manipulation.
Why Conversational BI is the Future of SaaS
Traditional Business Intelligence (BI) tools have a "steep wall" problem: they require technical expertise to get deep answers. An AI-driven approach provides:
- Speed: No more waiting for "End of Month" reports.
- Accessibility: Anyone on the team (Marketing, Sales, CS) can get data-backed answers.
- Context: The AI doesn't just give you a number; it explains why the number moved.
Ask Hard Questions, Get Clear Answers
The true power of the Chartsy AI chatbot lies in its ability to handle multi-layered queries. Here is how it handles the "Big Four" SaaS metrics.
1. "What’s my MRR growth this month?"
Monthly Recurring Revenue (MRR) is the lifeblood of your SaaS. Instead of manually calculating net-new vs. expansion MRR, you simply ask.
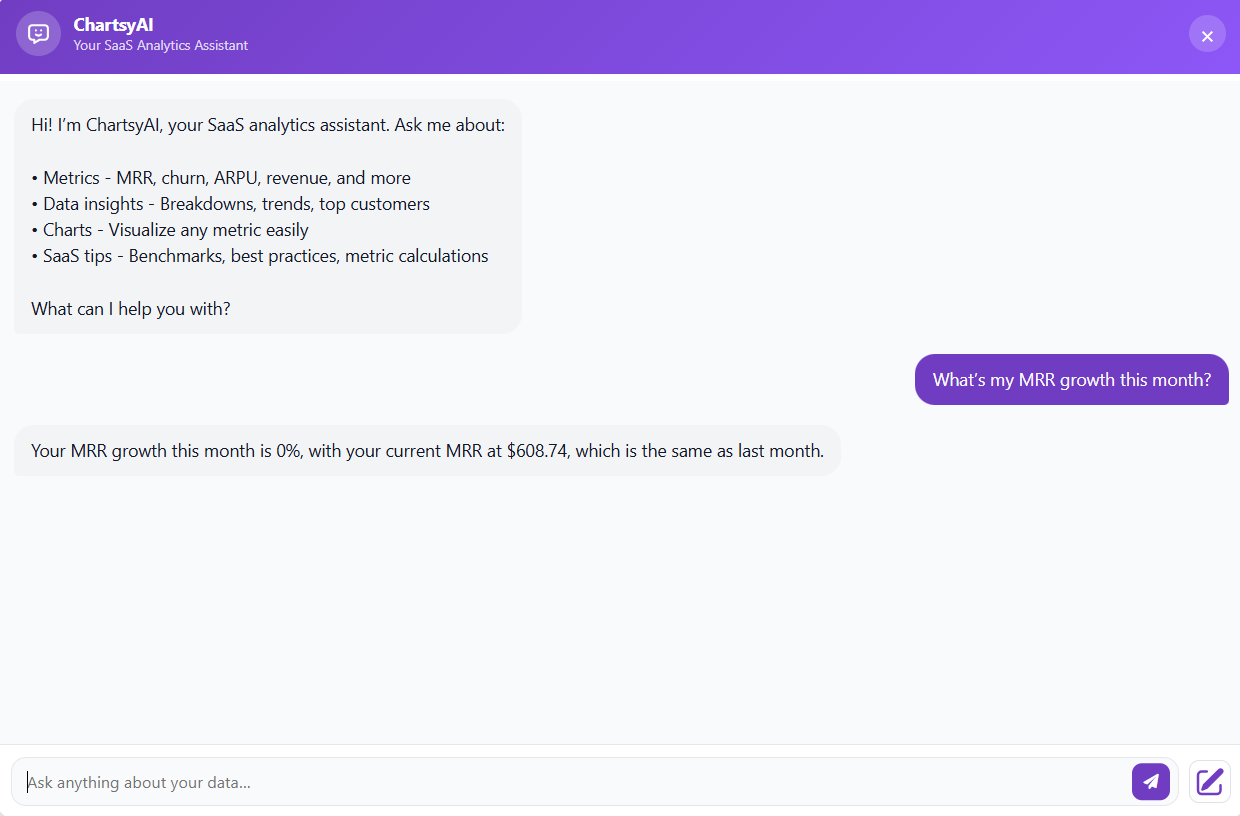 Figure 1: Querying real-time MRR growth trends using Chartsy's conversational AI.
The chatbot calculates your MRR using live subscription data, compares it to the previous period, and returns:
- The Raw Numbers: Total MRR and percentage growth.
- The Narrative: A breakdown of what drove the growth (e.g., "Growth was driven primarily by 15 new Pro plan signups").
2. "Why did churn increase last quarter?"
When churn spikes, timing is everything. Our AI digs into cancellations, downgrades, and at-risk cohorts to surface trends that are often buried in standard charts.
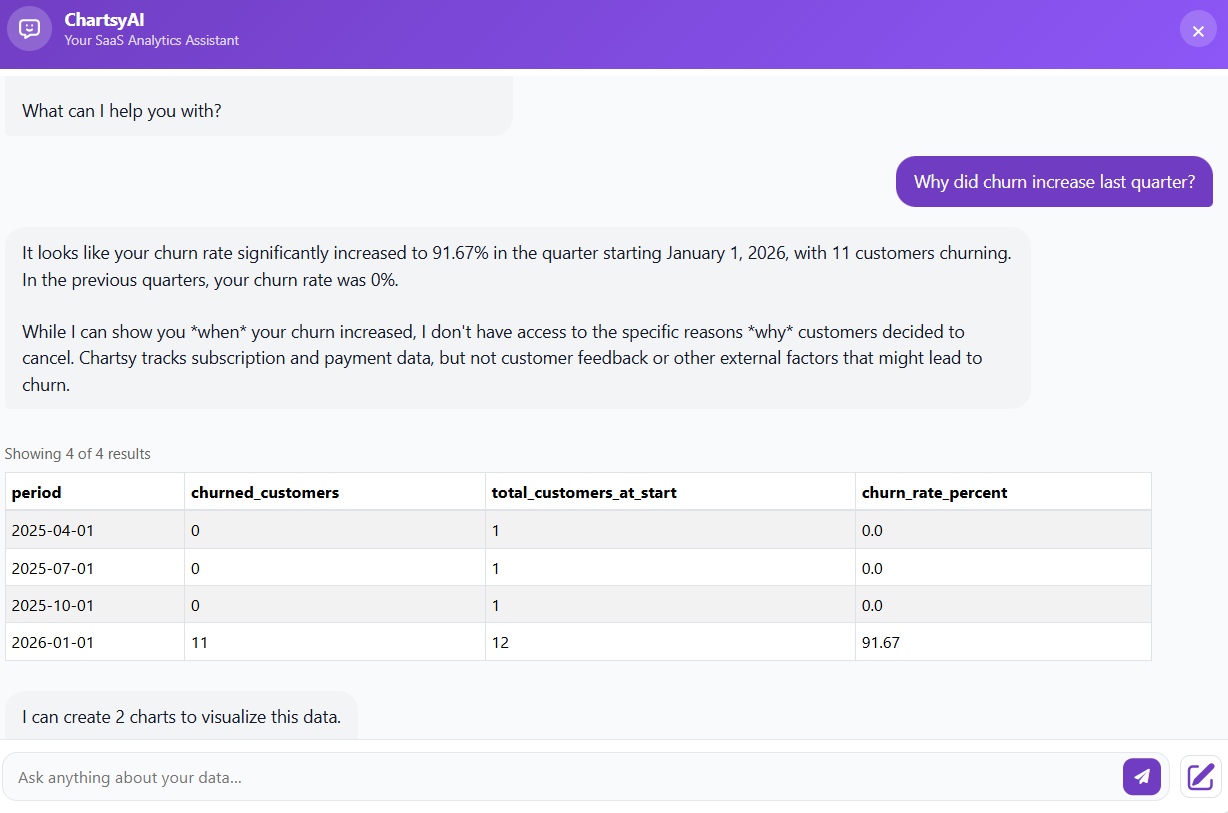 Figure 2: Analyzing churn spikes and retention patterns via the Chartsy AI interface.
It identifies if the spike was caused by a specific pricing plan or a seasonal anomaly, helping you pivot your retention strategy in real-time.
3. "Which customer segments have the highest LTV?"
Understanding Lifetime Value (LTV) is critical for efficient ad spend. You can ask the AI to segment your data by acquisition channel, pricing plan, geography, or customer type.
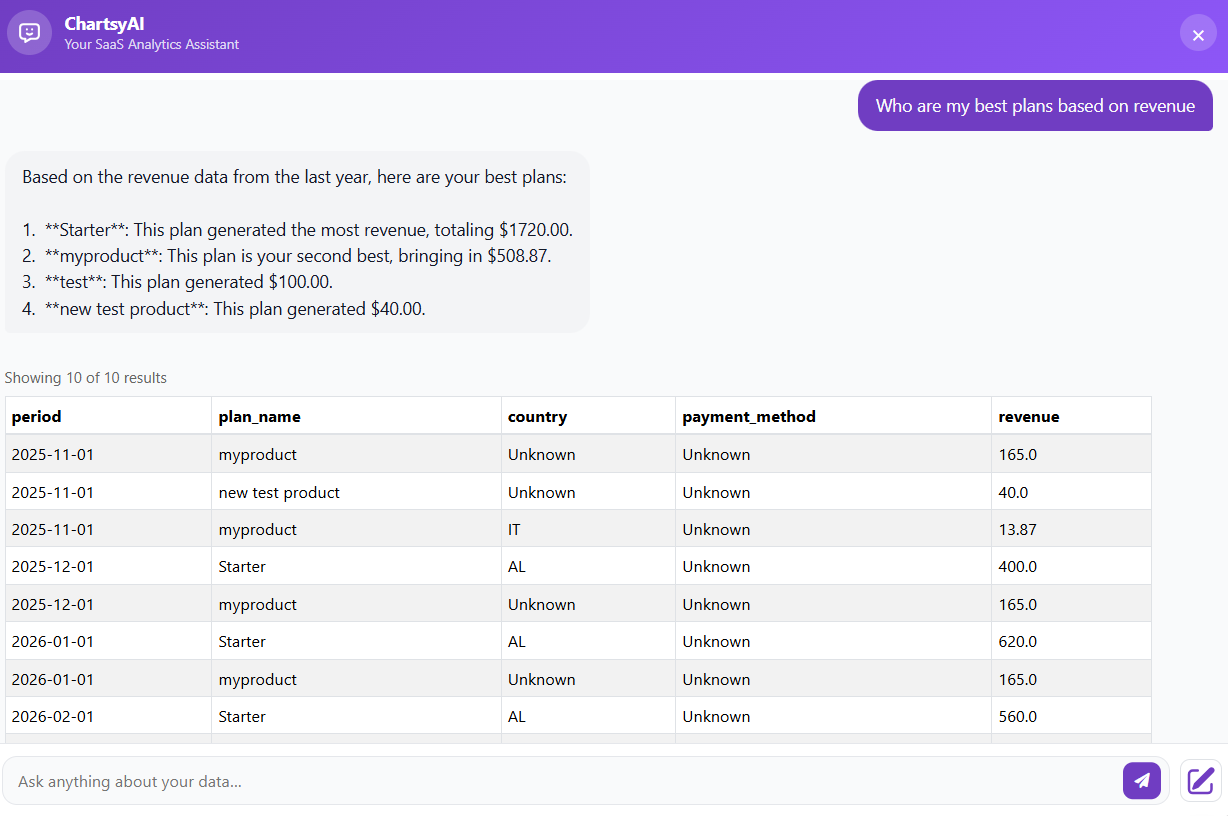 Figure 3: Breaking down revenue and LTV by plan segment using natural language.
4. "How do my metrics compare to SaaS benchmarks?"
Raw data lacks meaning without context. Chartsy’s AI compares your performance against industry standards for your specific ARR stage.
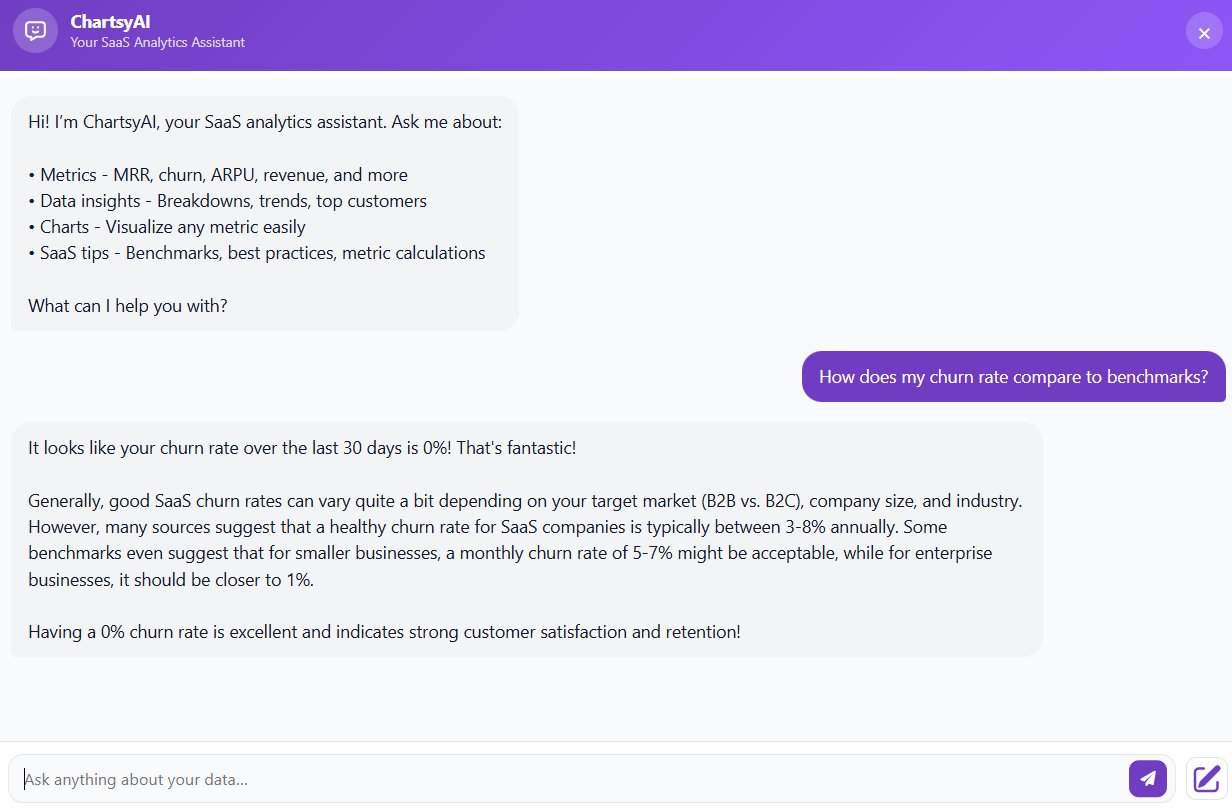 Figure 4: Benchmarking internal SaaS metrics against industry standards for growth-stage startups.
It tells you if your 5% churn is a "Gold Standard" or a "Red Flag," and which levers are most likely to move the needle.
Visual Insights at Your Fingertips
The AI chatbot doesn’t just stop at text. When it detects that a trend is better understood visually, it will suggest generating a chart. With one click, you can instantly visualize:
- Cohort Analysis: Visualizing how long users stay.
- Revenue Heatmaps: Spotting geographic expansion opportunities.
- Retention Curves: Identifying exactly when users drop off.
Charts appear in the same interface, and you can save them directly to your dashboards for future reference.
Bridging the Gap Between Data and Action
The goal of this feature is Data Democratization. In a typical SaaS company, the "data bottleneck" happens because only a few people know how to navigate the analytics stack. By using an AI chatbot for SaaS data, you empower your entire team to be data-driven.
"Based on real-world use cases, we've seen that teams using conversational analytics reduce their time-to-insight by over 80%. Instead of a 20-minute dashboard deep-dive, it's a 10-second chat."
How to Get Started (Step-by-Step)
- Connect Your Source: Log in to Chartsy and ensure your Stripe or Paddle account is synced.
- Open the Chat: Click the "Ask Chartsy" icon in the bottom right of your dashboard.
- Ask a Question: Start with something simple like "Show me my revenue for the last 30 days."
- Drill Down: Follow up with "How does that compare to the previous 30 days?"
- Save to Dashboard: If the AI generates a chart you love, click "Save Chart" for permanent access.
FAQ: Using AI for SaaS Analytics
Is my SaaS data safe with an AI chatbot? Yes. Chartsy uses enterprise-grade encryption. The AI processes your data to generate answers but does not "learn" from your proprietary business secrets for other users.
Does the AI work with Stripe and Paddle? Absolutely. The AI chatbot is fully integrated with our primary data connectors, ensuring your MRR and churn calculations are always based on the "Source of Truth."
Can the AI predict future growth? While the AI is best at analyzing historical and current data, it can identify growth trends (momentum) to help you forecast where your ARR will be by the end of the quarter.
Conclusion
The era of clicking through twenty different tabs to find one metric is over. With Chartsy’s new AI chatbot for SaaS data, your metrics are finally as mobile and conversational as your team. Whether you are prepping for a board meeting or just checking your morning growth, the answers are now just one sentence away.
Ready to talk to your data? Log in to your Chartsy Dashboard today and ask your first question.

Written by
Serena PriftiSerena Prifti is the founder of Chartsy and writes about analytics, growth, and subscription metrics. She focuses on helping founders and operators turn raw data into clear insights that drive better decisions.
Serena Prifti