
Chartsy vs ProfitWell: The Modern Alternative for Subscription Analytics
ProfitWell has long been a go-to platform for subscription analytics, offering clean dashboards for MRR, churn, retention, and pricing insights. It’s a strong choice for SaaS teams that need standard subscription metrics without getting technical.
But analytics expectations have shifted.
Founders and operators want something faster, more flexible, and more interactive - a tool that adapts to their questions instead of locking them into predefined dashboards.
That’s exactly where Chartsy stands out.
Chartsy gives you AI-powered analytics on top of your Paddle data.
But how does it stack up against ProfitWell?
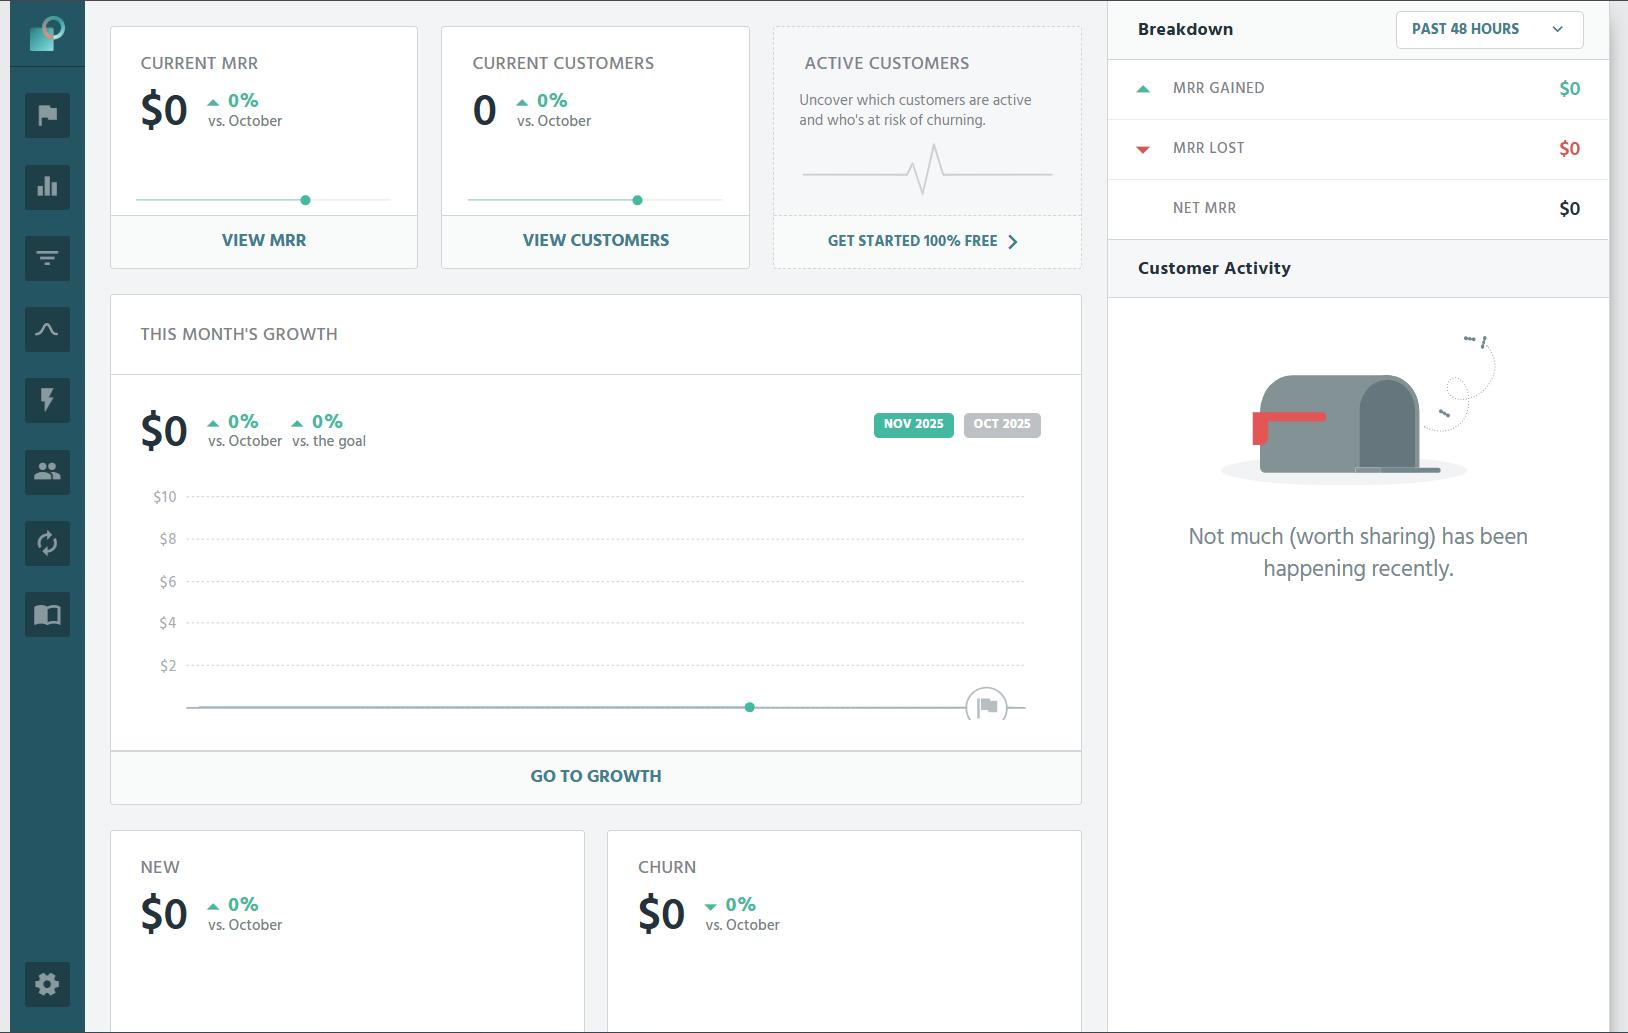
ProfitWell: Great for Standard SaaS Metrics
ProfitWell delivers a clear, structured view of your subscription performance. It covers essential metrics such as MRR, churn, retention, customer segmentation, revenue recognition, and, depending on the plan, pricing insights.
For teams who just want a reliable snapshot of their business, it’s clean, simple, and straightforward.
Where it falls short is flexibility. Its dashboards are predefined and cannot be deeply customized. You can’t ask new questions or generate charts that fall outside ProfitWell’s set of reports. Exploration stays limited to what ProfitWell chooses to surface.
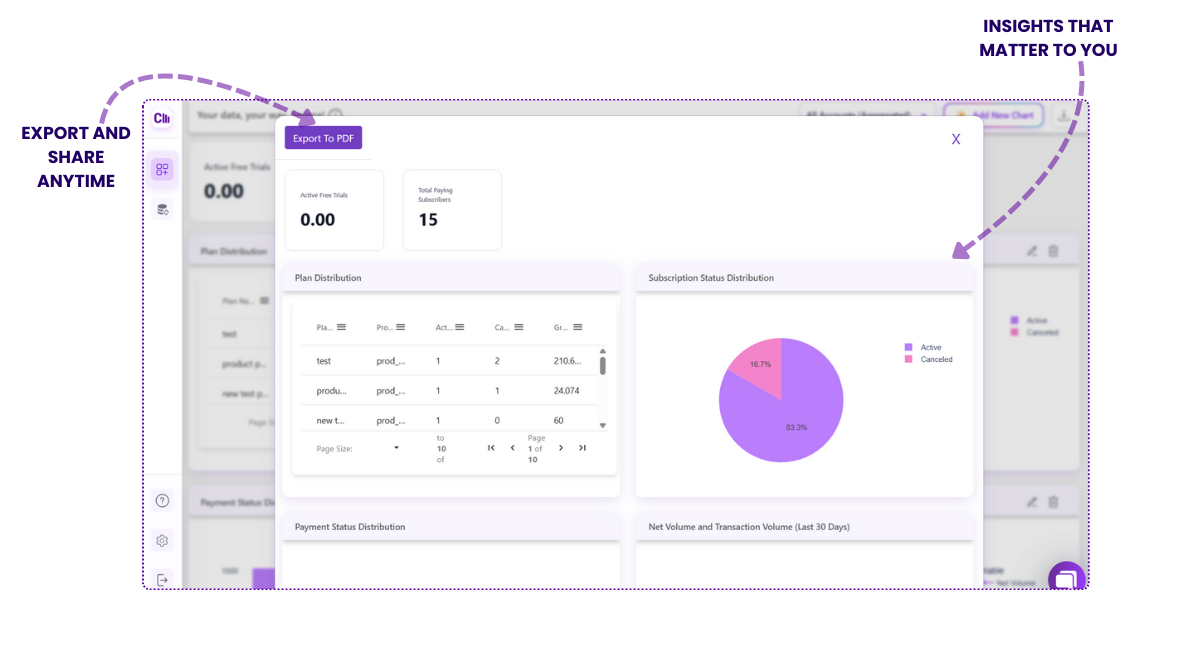
Chartsy: Ask Anything, Visualize Anything
Chartsy flips the traditional analytics model.
Rather than giving you a fixed set of dashboards, Chartsy lets you explore your Paddle data your way. You can ask any question, generate any chart, switch visualization types, and save everything into dashboards that reflect your unique metrics and goals.
It also includes practical tools like downloading any chart as a PNG and exporting full dashboards as clean, ready-to-share PDFs.
Examples of what users typically explore:
“What’s my MRR over the last 12 months?”
“Show churn by country.”
“Compare ARPU for each plan.”
“Break down new vs returning subscriptions.”
Chartsy interprets your question, identifies the right fields, chooses the right chart type, and presents insights in seconds.
While ProfitWell gives you dashboards designed for you, Chartsy builds dashboards with you - instantly and interactively.
Where They Differ Most
| Category | ProfitWell | Chartsy |
|---|---|---|
| Flexibility | Predefined dashboards, limited customization | Fully dynamic - ask any question, create any chart |
| Data Exploration | Good for monitoring | Ideal for discovering insights and building custom analytics |
| Workflow | Browse through dashboards | Type a question → get a chart → add it to your dashboard |
| For Teams | Great for leadership snapshots | Great for founders, analysts, marketers, product teams - anyone asking questions |
| Exports | Limited exporting | Export dashboards as PDF + download charts as PNG |
Why Choose Chartsy Instead
Chartsy is designed for teams that want speed, clarity, and zero friction. Instead of relying on SQL, manual analysis, or rigid dashboards, Chartsy adapts instantly to your questions and presents insights in visual form.
You can build dashboards that match your business, explore trends in real time, compare products or regions, and generate reports with a single click. With PDF exports and PNG downloads, sharing insights with investors or teammates becomes effortless.
Chartsy doesn’t replace ProfitWell’s philosophy - it expands on it, giving you freedom to explore your data without constraints.
The Bottom Line
If you want predefined dashboards that cover the basics, ProfitWell is a strong option.
If you want a modern analytics platform that adapts to your questions, generates instant charts, supports PDF and PNG exports, and helps you build dashboards shaped around your business - Chartsy is designed for that.
Connect your Paddle account and start exploring your subscription data with natural language.
Ask a question → get the most relevant chart → save it to a dashboard built for your business.

Written by
Chartsy TeamThe Chartsy Team writes guides, product updates, and resources to help SaaS and eCommerce founders make sense of their metrics, without SQL or spreadsheets.
Chartsy