
Choosing between Chartsy and Stripe Sigma? Both tools give you deeper access to your Stripe data than the default dashboard - but they're built for completely different users and workflows.
Most teams working with Stripe analytics rely on two familiar tools: the Stripe Dashboard for quick, high-level insights and Stripe Sigma for deeper, SQL-powered analysis. Sigma is undeniably flexible, and Dashboard gives you the standard metrics every Stripe user expects. But even together, they keep you inside predefined reports, predefined metrics, and predefined ways of exploring your data.
This is where Chartsy comes in. Instead of restricting you to the metrics Stripe chooses, Chartsy lets you ask any question, explore any metric, and build dashboards around the way your business works. No SQL. No digging. Just natural language → instant visual insights → dashboards you shape around what you need to track or share.
Where They Differ (And Why It Matters)
| Feature / Capability | Chartsy | Stripe Dashboard | Stripe Sigma |
|---|---|---|---|
| Data Exploration | Ask any question in natural language, instant charts | Fixed reports, limited exploration | Full SQL access for custom queries |
| Ease of Use | No SQL, no setup, fast insights | Very easy for basics | Requires SQL knowledge |
| Customization | Fully flexible dashboards based on your questions | Minimal customization | Highly customizable through SQL |
| Best For | Founders, operators, anyone wanting fast insights | Quick daily monitoring | Data teams, analysts, technical users |
Stripe Dashboard → Good for basics, limited for deeper analysis
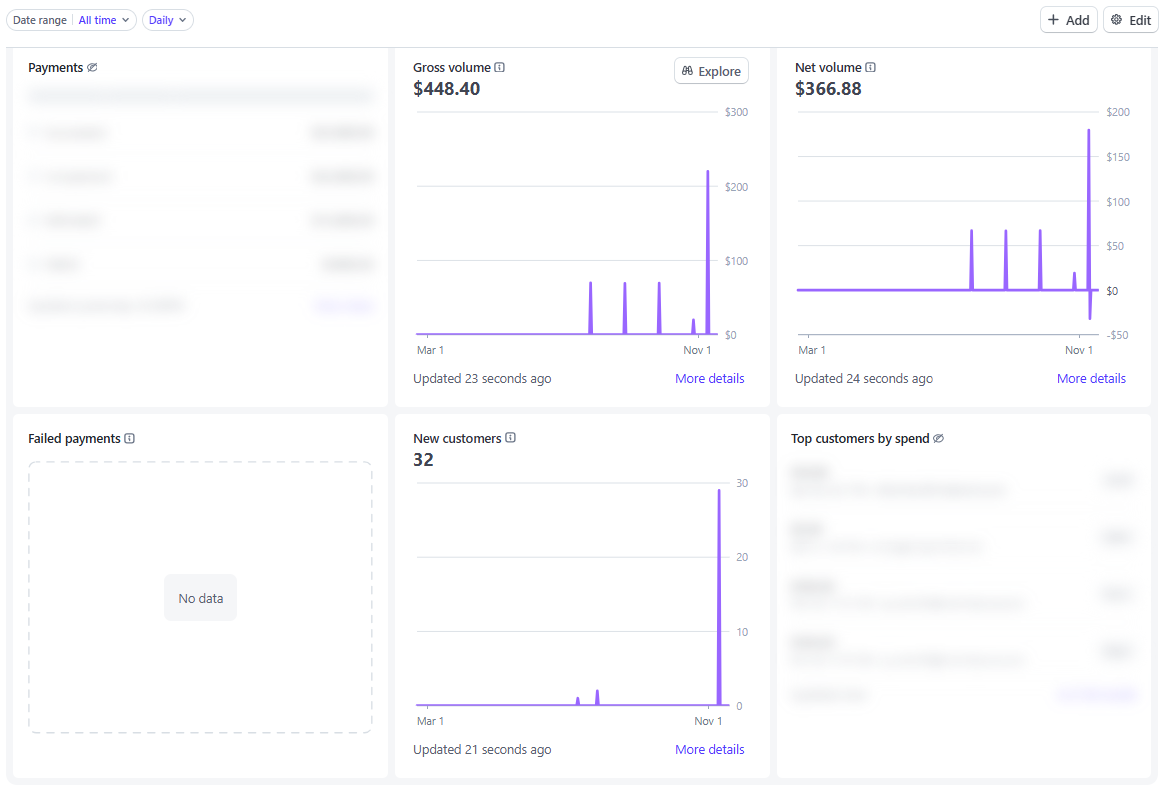
The Stripe Dashboard gives you the fundamentals: revenue summaries, customer lists, subscription numbers, charges, payouts, and a handful of trend reports. It's convenient for monitoring your business day-to-day, but it doesn't go far beyond that.
You can't ask your own questions, the visualizations are fixed, and you don't get deeper metrics like LTV, churn breakdowns, or cohort analysis. And because you can't build custom dashboards tailored to your model, you quickly run into a ceiling the moment your questions become more specific.
Stripe Sigma → Powerful, but requires SQL
Stripe Sigma is a SQL query environment built directly into your Stripe account. It gives analysts full access to your raw Stripe data - charges, subscriptions, customers, invoices, refunds - and lets them write custom sigma queries to answer almost any data question.
A typical sigma query to see monthly revenue looks like this:
SELECT DATE_TRUNC('month', created) AS month,
       SUM(amount) / 100.0 AS revenue
FROM charges
WHERE status = 'succeeded'
GROUP BY 1
ORDER BY 1 DESC
Or if you want to select date ranges and join subscription data with customer records across your Stripe account:
SELECT DATE_TRUNC('month', s.created) AS month,
       c.email,
       s.plan_id,
       s.status
FROM subscriptions s
LEFT JOIN customers c ON s.customer_id = c.id
WHERE s.created >= '2025-01-01'
ORDER BY 1 DESC
Sigma also lets you save these as a saved query for reuse, export results and view as markdown, and set up scheduled reports. For teams with a dedicated analyst, it's a genuinely powerful environment.
But the workflow is slow for everyone else: write SQL, run queries, inspect tables, convert results into charts, then save everything manually. There's no pre-calculated SaaS metrics layer - you have to derive MRR, churn, and LTV yourself from raw event data. And because it only connects to Stripe data, any cross-referencing with your CRM or product analytics requires manual exports.
Want the full picture on Stripe Sigma? Our in-depth breakdown covers its features, pricing model, and limitations in detail: What Is Stripe Sigma? Features, Pricing & Limitations.
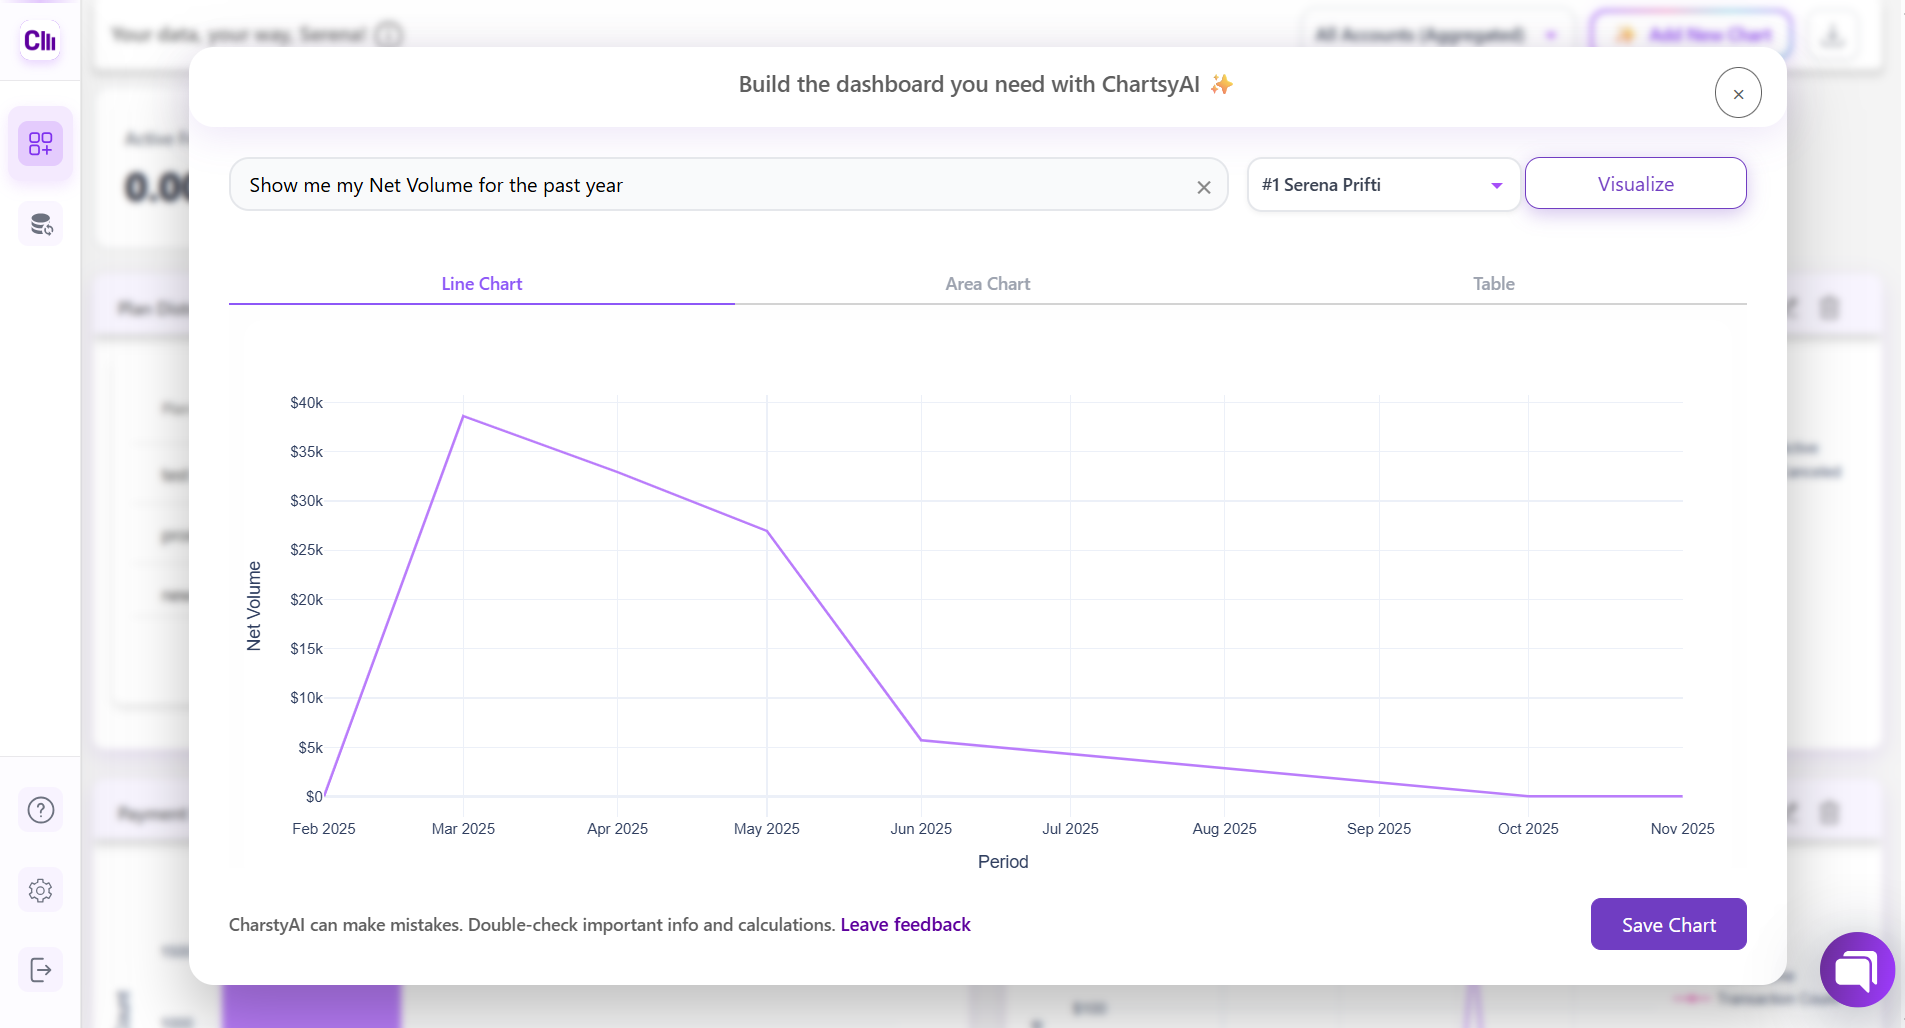
Chartsy → Instant Insight for Every Question That Matters
Chartsy removes all the complexity. You simply ask questions like:
"What's my MRR for the last 12 months?"
"Show churn by country."
"Which plans are growing fastest?"
Chartsy understands your request, finds the right Stripe data, picks the best chart type, formats it, and returns the visualization instantly. No SQL. No manual chart building. No navigating through fixed dashboards. Just visual answers on demand.
Compared to Stripe's tools, everything flips:
Instead of browsing, you ask.
Instead of SQL, you get AI.
Instead of tables, you get ready-to-use charts.
Chartsy Completes Stripe (It Doesn't Replace It)
Chartsy isn't a replacement for Stripe Dashboard or Sigma - it fills the gap between them.
The Stripe Dashboard is great for operational monitoring.
Stripe Sigma is great for technical, SQL-driven analysis.
Chartsy is great for turning everyday questions into charts instantly.
It's the analytics layer Stripe never built.
Start analyzing your Stripe data in seconds
Connect your Stripe account and ask your first question - Chartsy instantly turns your data into the dashboard you need, with no technical skills or analytics background required.
Chartsy also works with Paddle, supporting subscription analytics across multiple payment providers.

Written by
Chartsy TeamThe Chartsy Team writes guides, product updates, and resources to help SaaS and eCommerce founders make sense of their metrics, without SQL or spreadsheets.
Chartsy