
Most BigCommerce merchants hit the same wall eventually: the built-in analytics dashboard is fine for basic monitoring - revenue, orders, top products - but it can’t answer the deeper questions that actually guide growth.
For example:
- Which customer segment has the highest lifetime value (LTV)?
- Which products are driving repeat purchases?
- How do specific customer cohorts retain over time?
Many assume building a custom BigCommerce dashboard requires a developer, APIs, or a data team. It doesn’t.
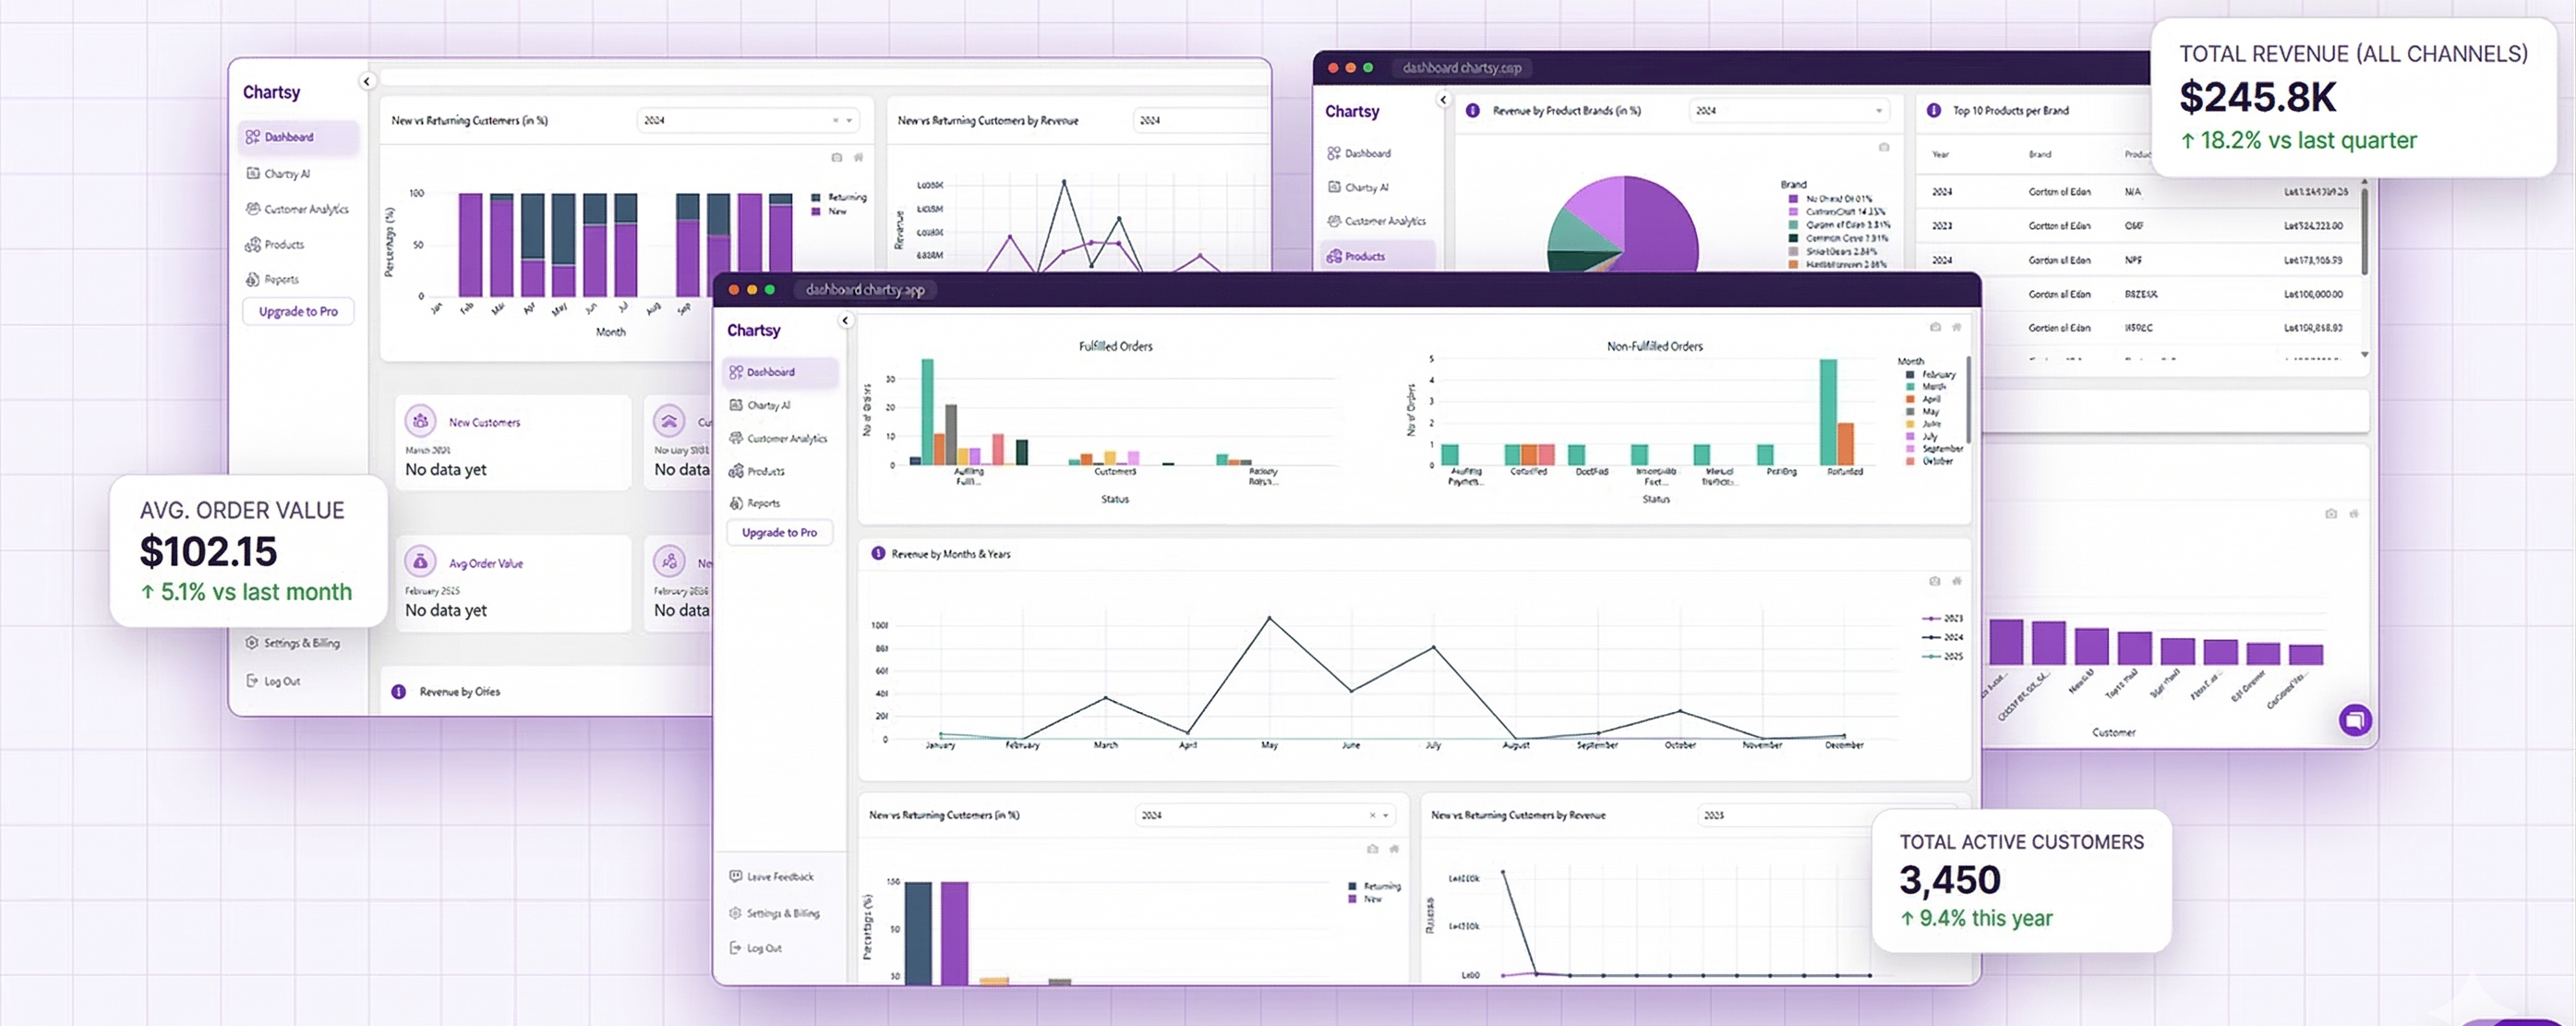
With Chartsy for BigCommerce, you can access a ready-to-use dashboard with pre-built metrics for sales, products, and customers - including segmentation - and ChartsyAI lets you add, edit, or delete graphs on the fly. You don’t need coding skills or spreadsheets.
In this guide, you’ll learn:
- Why merchants struggle with BigCommerce reporting dashboards
- What metrics a BigCommerce dashboard should include
- How to set up Chartsy for BigCommerce
- How to use ChartsyAI to customize and explore insights
Why Merchants Struggle to Build a BigCommerce Dashboard
The challenge isn’t the data. BigCommerce generates a wealth of information:
- Orders and revenue
- Customer activity and segmentation
- Product performance
- Marketing traffic and coupons
The problem is turning this raw data into actionable insights.
Most merchants encounter these obstacles:
-
BigCommerce built-in analytics is limited
Surface-level dashboards track revenue, orders, and top products but omit deeper metrics like LTV, cohort retention, churn, and repeat purchase behavior. -
BI tools require technical setup
Platforms like Looker Studio, Power BI, or Tableau require API connections, metric definitions, and ongoing maintenance. -
Spreadsheets don’t scale
Manual exports are tedious and error-prone, making regular reporting a chore. -
Hiring a developer is expensive
Custom dashboards often require backend development, data pipelines, and maintenance - a costly solution for most small teams.
Your Options: Comparing Ways to Build a BigCommerce Dashboard
Here’s how common approaches compare:
| Option | Setup Time | Cost | Developer Needed? | Best For |
|---|---|---|---|---|
| BigCommerce built-in analytics | 0 min | Included | No | Basic metrics |
| Looker Studio / Power BI | 3–14 days | Varies | Often | Custom visualizations |
| Excel / Google Sheets | Ongoing | Free | No | One-off reports |
| Chartsy for BigCommerce | <10 min | Free trial | No | Pre-built, ready-to-use metrics with ChartsyAI |
For most merchants, Chartsy for BigCommerce is the fastest path to a functional dashboard - no technical setup required.
What Should Be on Your BigCommerce Dashboard?
A useful BigCommerce dashboard covers three main areas, all of which Chartsy provides out-of-the-box:
| Dashboard Section | Key Metrics | Update Frequency |
|---|---|---|
| Sales | Total revenue, average order value (AOV), revenue trends | Daily |
| Products | Top products by revenue, sales velocity, refund rate | Weekly |
| Customers | New vs. returning customers, repeat purchase rate, segmentation, LTV estimates | Weekly |
Chartsy automatically pre-calculates all these metrics, including customer segmentation, so you can see which customer groups drive the most value.
Step-by-Step: Set Up Your BigCommerce Dashboard with Chartsy
Here’s how to go from zero to a full dashboard without coding or developers.
Step 1: Install Chartsy from BigCommerce
Chartsy for BigCommerce can only be installed from inside your BigCommerce store:
- Go to your BigCommerce admin → Apps → Find Chartsy
- Click Install
- Grant read-only access to your store data
Your store’s data will sync automatically - no exports or API setup needed.
Step 2: Explore Pre-Built Metrics
Once installed, your Chartsy dashboard comes ready with:
- Sales overview (revenue, AOV, trends)
- Product performance (top products, velocity, refunds)
- Customer metrics (new vs. returning, repeat purchase, LTV, segmentation)
No configuration is required; all metrics are automatically calculated based on your store data.
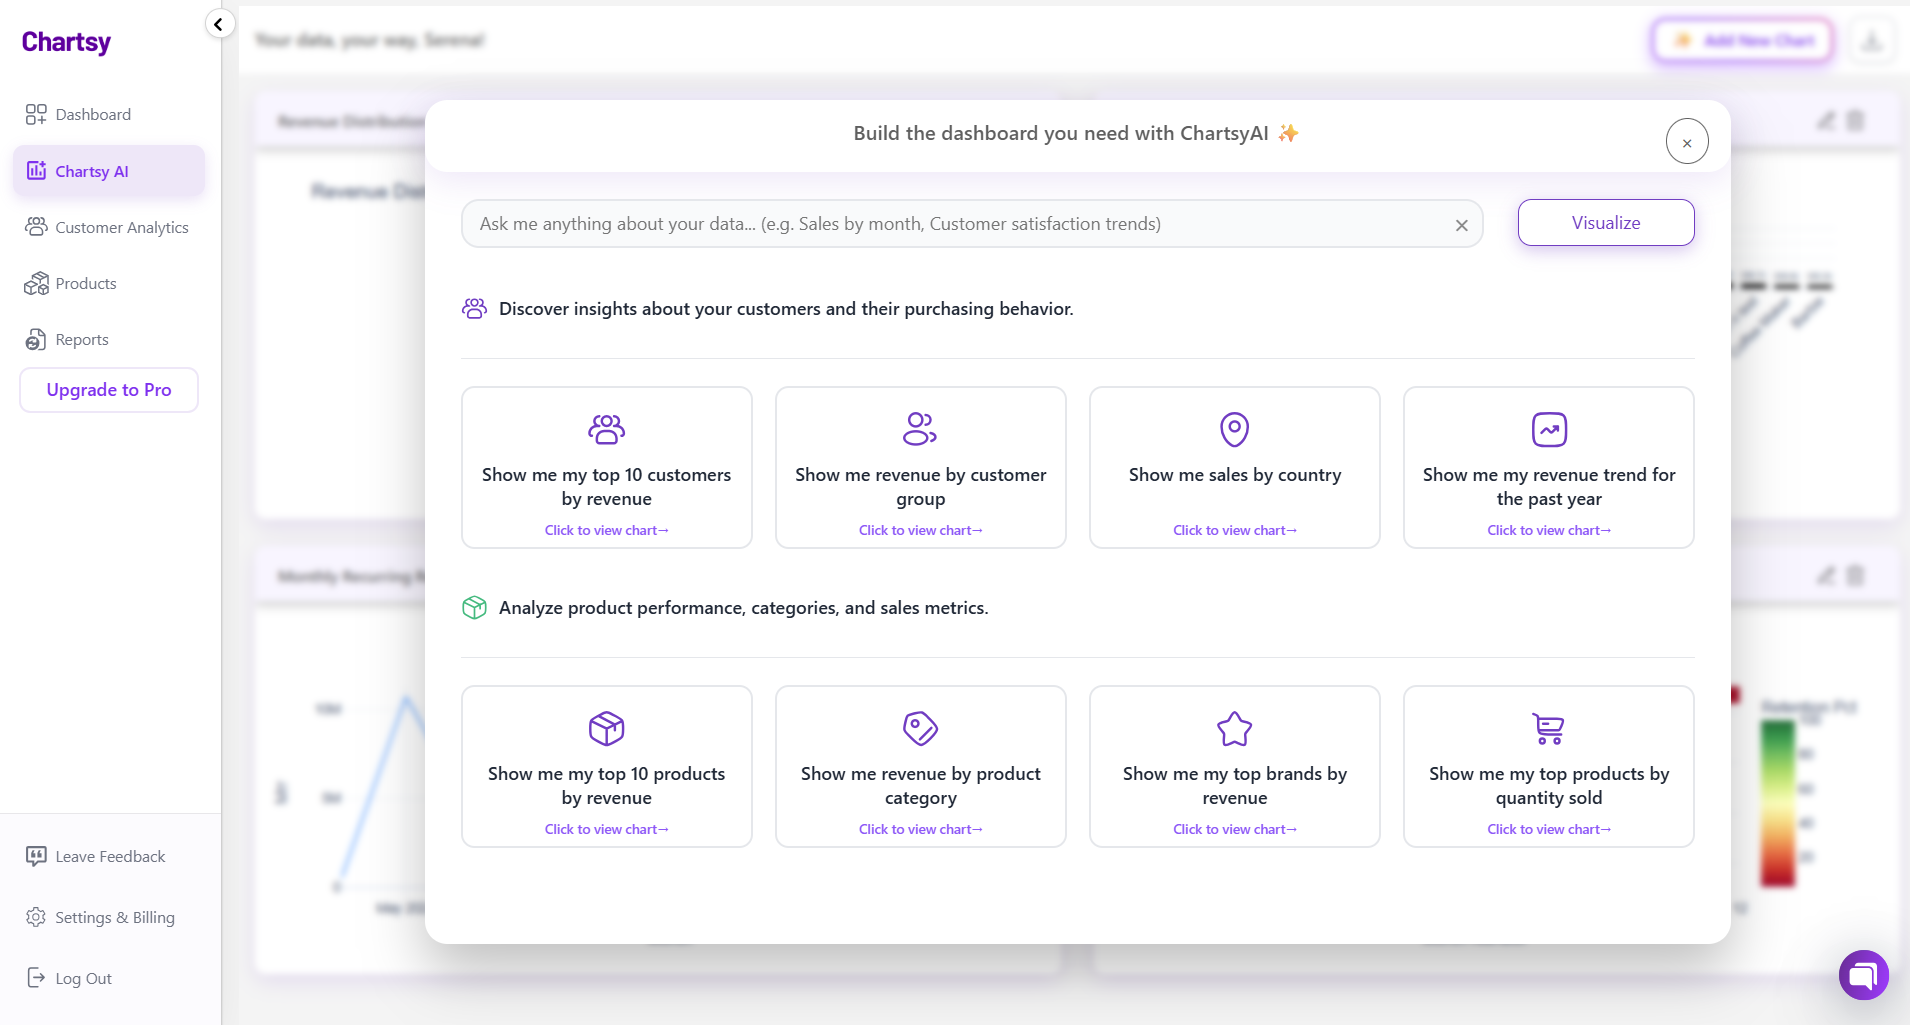
Step 3: Customize with ChartsyAI
While you cannot move or rearrange the dashboard, ChartsyAI allows you to:
- Add new graphs
- Edit existing graphs
- Delete unnecessary graphs
This flexibility ensures your dashboard always reflects the metrics you care about.
For example, you can ask ChartsyAI:
- "Show top 10 products by revenue last month"
- "Which customer segment has the highest repeat purchase rate?"
- "Visualize refund trends by product category"
Step 4: Use Insights for Decisions
Chartsy gives you actionable insights in real time:
- Identify high-value customer segments
- Monitor product performance trends
- Track revenue and repeat purchase metrics without exporting data
Even though the dashboard layout is fixed, ChartsyAI ensures your analysis is dynamic and interactive.
Common BigCommerce Dashboard Mistakes to Avoid
Even with Chartsy, avoid these pitfalls:
-
Tracking too many metrics
Focus on 5–10 metrics that inform decisions. Pre-built dashboards help avoid clutter. -
Ignoring segmentation
Aggregate numbers hide patterns. Use customer segmentation to see which groups drive growth. -
Watching only snapshots
Trends are more important than single numbers. Use pre-built charts for time-based insights. -
Keeping analytics to yourself
Share dashboard access with your team so everyone can act on the data.
The Bottom Line
Building a BigCommerce dashboard used to require developers or complex BI tools.
With Chartsy for BigCommerce:
- Installation is in-app, no code required
- Metrics are pre-built for sales, products, and customers
- Customer segmentation is automatic
- ChartsyAI lets you add, edit, or delete graphs for dynamic insights
Turn your daily store data into actionable decisions - without SQL, spreadsheets, or technical setup.
Build your BigCommerce dashboard with Chartsy for free → chartsy.app

Written by
Serena PriftiSerena Prifti is the founder of Chartsy and writes about analytics, growth, and subscription metrics. She focuses on helping founders and operators turn raw data into clear insights that drive better decisions.
Serena Prifti