
Track MRR, Retention, and Sustainable Growth with Chartsy
If you run a SaaS business, this probably sounds familiar:
You open Stripe or Paddle, skim through the numbers, export a CSV “just to double-check something,” and suddenly you’re buried in a spreadsheet trying to figure out what actually changed this month.
More signups… but lower revenue?
MRR is up… but retention slipped?
Understanding recurring revenue shouldn’t feel like solving a puzzle-especially when decisions need to be made fast.
That’s where Chartsy comes in.
Instead of juggling exports and manual calculations, Chartsy gives you a clear recurring revenue dashboard that answers the real question:
How healthy is my SaaS revenue, and what’s driving it?
Below is a practical use case showing the three core SaaS metrics every team should monitor to understand growth trends with confidence.
MRR vs Previous Period
Why it matters
Monthly Recurring Revenue (MRR) is the heartbeat of any SaaS business. It’s the first metric you check after a pricing change, feature launch, or marketing campaign. A quick comparison tells you whether momentum is building-or quietly slowing down.
With Chartsy, you don’t need custom queries or spreadsheets.
Simply ask:
“Compare this month’s MRR to last month’s.”
The result appears instantly, and you can save it to your dashboard to track revenue growth over time. Each time you log in, you see direction-not just numbers.
This helps you understand:
- Are we growing faster or starting to plateau?
- Did last month’s launch actually impact revenue?
- Are upgrades, downgrades, or churn shaping the trend?
Prompt you can use in Chartsy:
Compare this month's MRR to last month’s MRR.
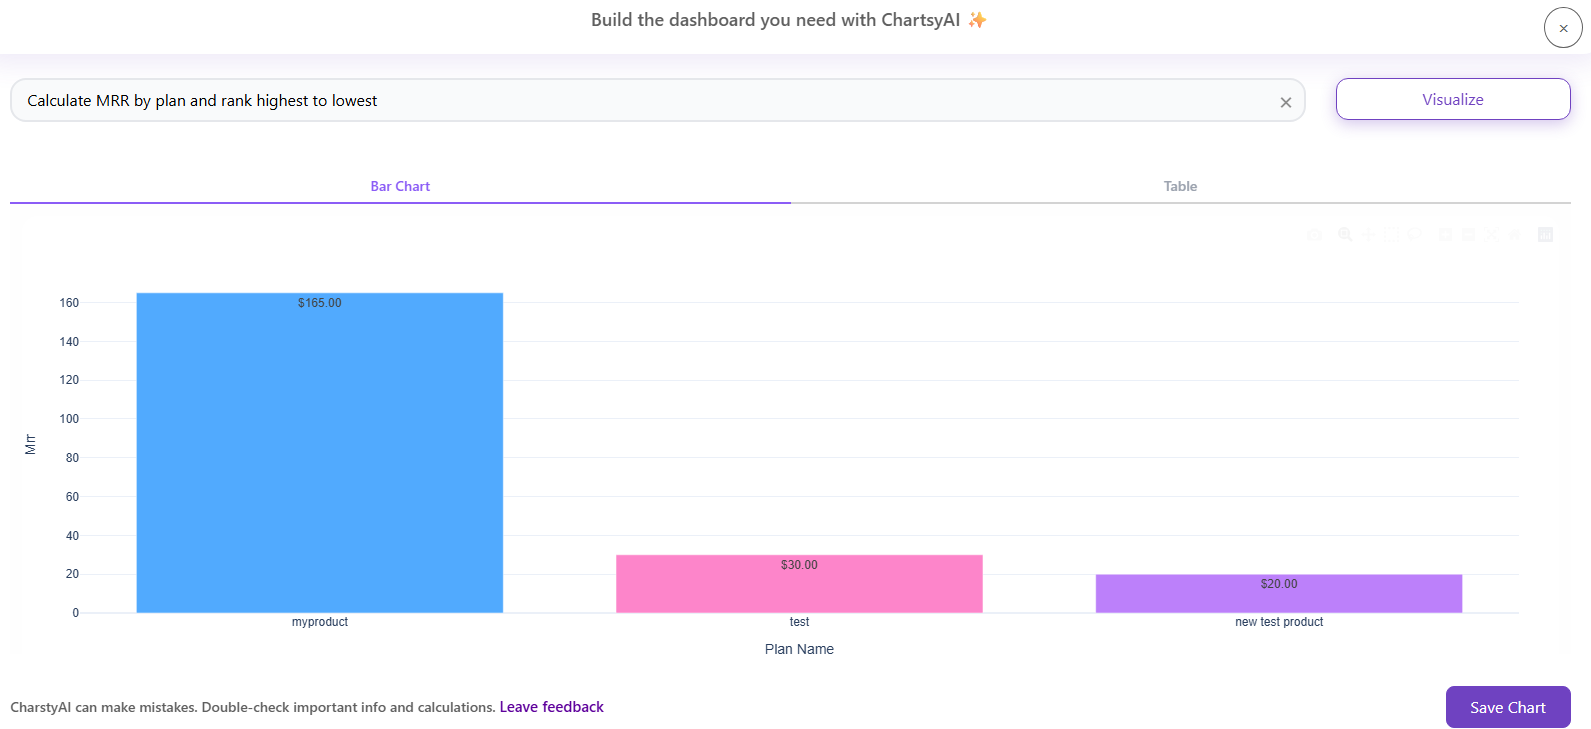
Top-Performing Products or Plans
Why it matters
Most SaaS teams think they know which plans drive revenue-but assumptions don’t scale. In reality, your mid-tier plan may outperform your entry plan, or a small group of high-value customers may generate more revenue than volume alone.
Chartsy breaks down MRR by plan or product so you can see exactly where recurring revenue comes from. Once saved, this chart becomes a reliable signal you can revisit anytime-without rework.
This reveals:
- Which subscription plan is your true revenue driver
- Whether high-value customers outweigh lower-tier volume
- If a pricing change could unlock additional growth
Prompt you can use in Chartsy:
Calculate MRR by plan and rank highest to lowest.
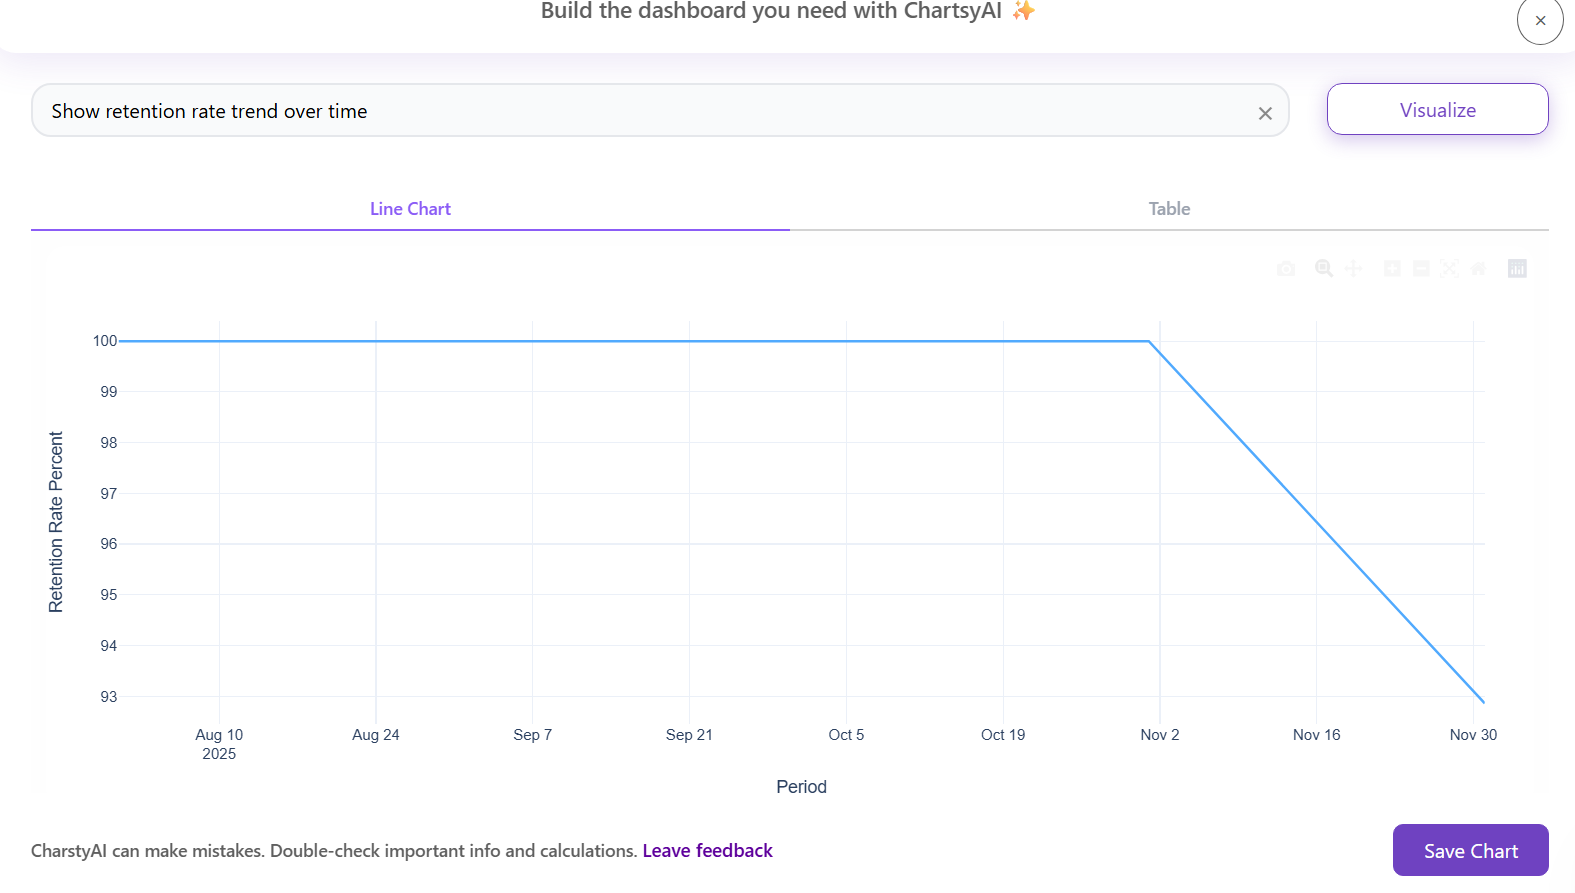
Customer Retention Trend
Why it matters
Revenue growth means little if customers don’t stay.
A spike in new signups might look great today-but churn tells the real story a few weeks later. Long-term SaaS success depends on retention, not just acquisition.
Chartsy visualizes customer retention trends over time, helping you understand whether your product is genuinely sticky. You generate the chart once, save it, and it updates automatically as new data comes in.
This shows you:
- Whether customers stay long enough to be profitable
- If upgrades offset cancellations
- How onboarding, support, and new features affect loyalty
Prompt you can use in Chartsy:
Show retention rate trend over time.
Why This SaaS Revenue Dashboard Matters
A great SaaS dashboard doesn’t just report metrics-it tells a story.
When you track these three metrics together in Chartsy, you move beyond surface-level reporting and start understanding what actually drives growth.
| Metric | What it tells you |
|---|---|
| MRR vs previous period | Are we growing faster or slowing down? |
| Top-performing plans | Where recurring revenue truly comes from |
| Retention trend | Whether growth is sustainable long-term |
For SaaS teams using Stripe or Paddle, this dashboard turns raw transaction data into strategic insight.
Not just revenue-direction.
Building a SaaS? This Dashboard Becomes Your Compass
Whether you’re early-stage or scaling fast, Chartsy helps you:
- Visualize MRR and recurring revenue trends at a glance
- Detect churn before it becomes expensive
- Identify which plans actually perform
- Monitor long-term customer retention
- Make decisions based on data-not gut feeling
Your revenue already tells a story.
Chartsy helps you read it.

Written by
Chartsy TeamThe Chartsy Team writes guides, product updates, and resources to help SaaS and eCommerce founders make sense of their metrics, without SQL or spreadsheets.
Chartsy