Even in 2026, many BigCommerce store owners still struggle to get the data they really need. Simple reports - like seeing your customers’ business names, billing addresses, and revenue in one place - often require multiple exports or technical work.
One store owner shared their frustration online. They wanted to analyze customer data efficiently, but BigCommerce’s built-in reports just weren’t enough.
“Am I really going to have to pay a developer to get this data via API? I know nothing about using the store API really. This seems totally absurd in 2026.”
This is exactly the kind of problem that inspired the creation of Chartsy, an AI-powered analytics tool for BigCommerce.
The Challenge
The store’s pain points were clear:
- Data silos: Company names, billing addresses, and revenue were stored in separate reports.
- Time-consuming work: Manual reporting slowed down decision-making.
- Limited flexibility: Standard analytics tools didn’t allow the store owner to explore B2B customer data the way they needed.
The Solution: Chartsy
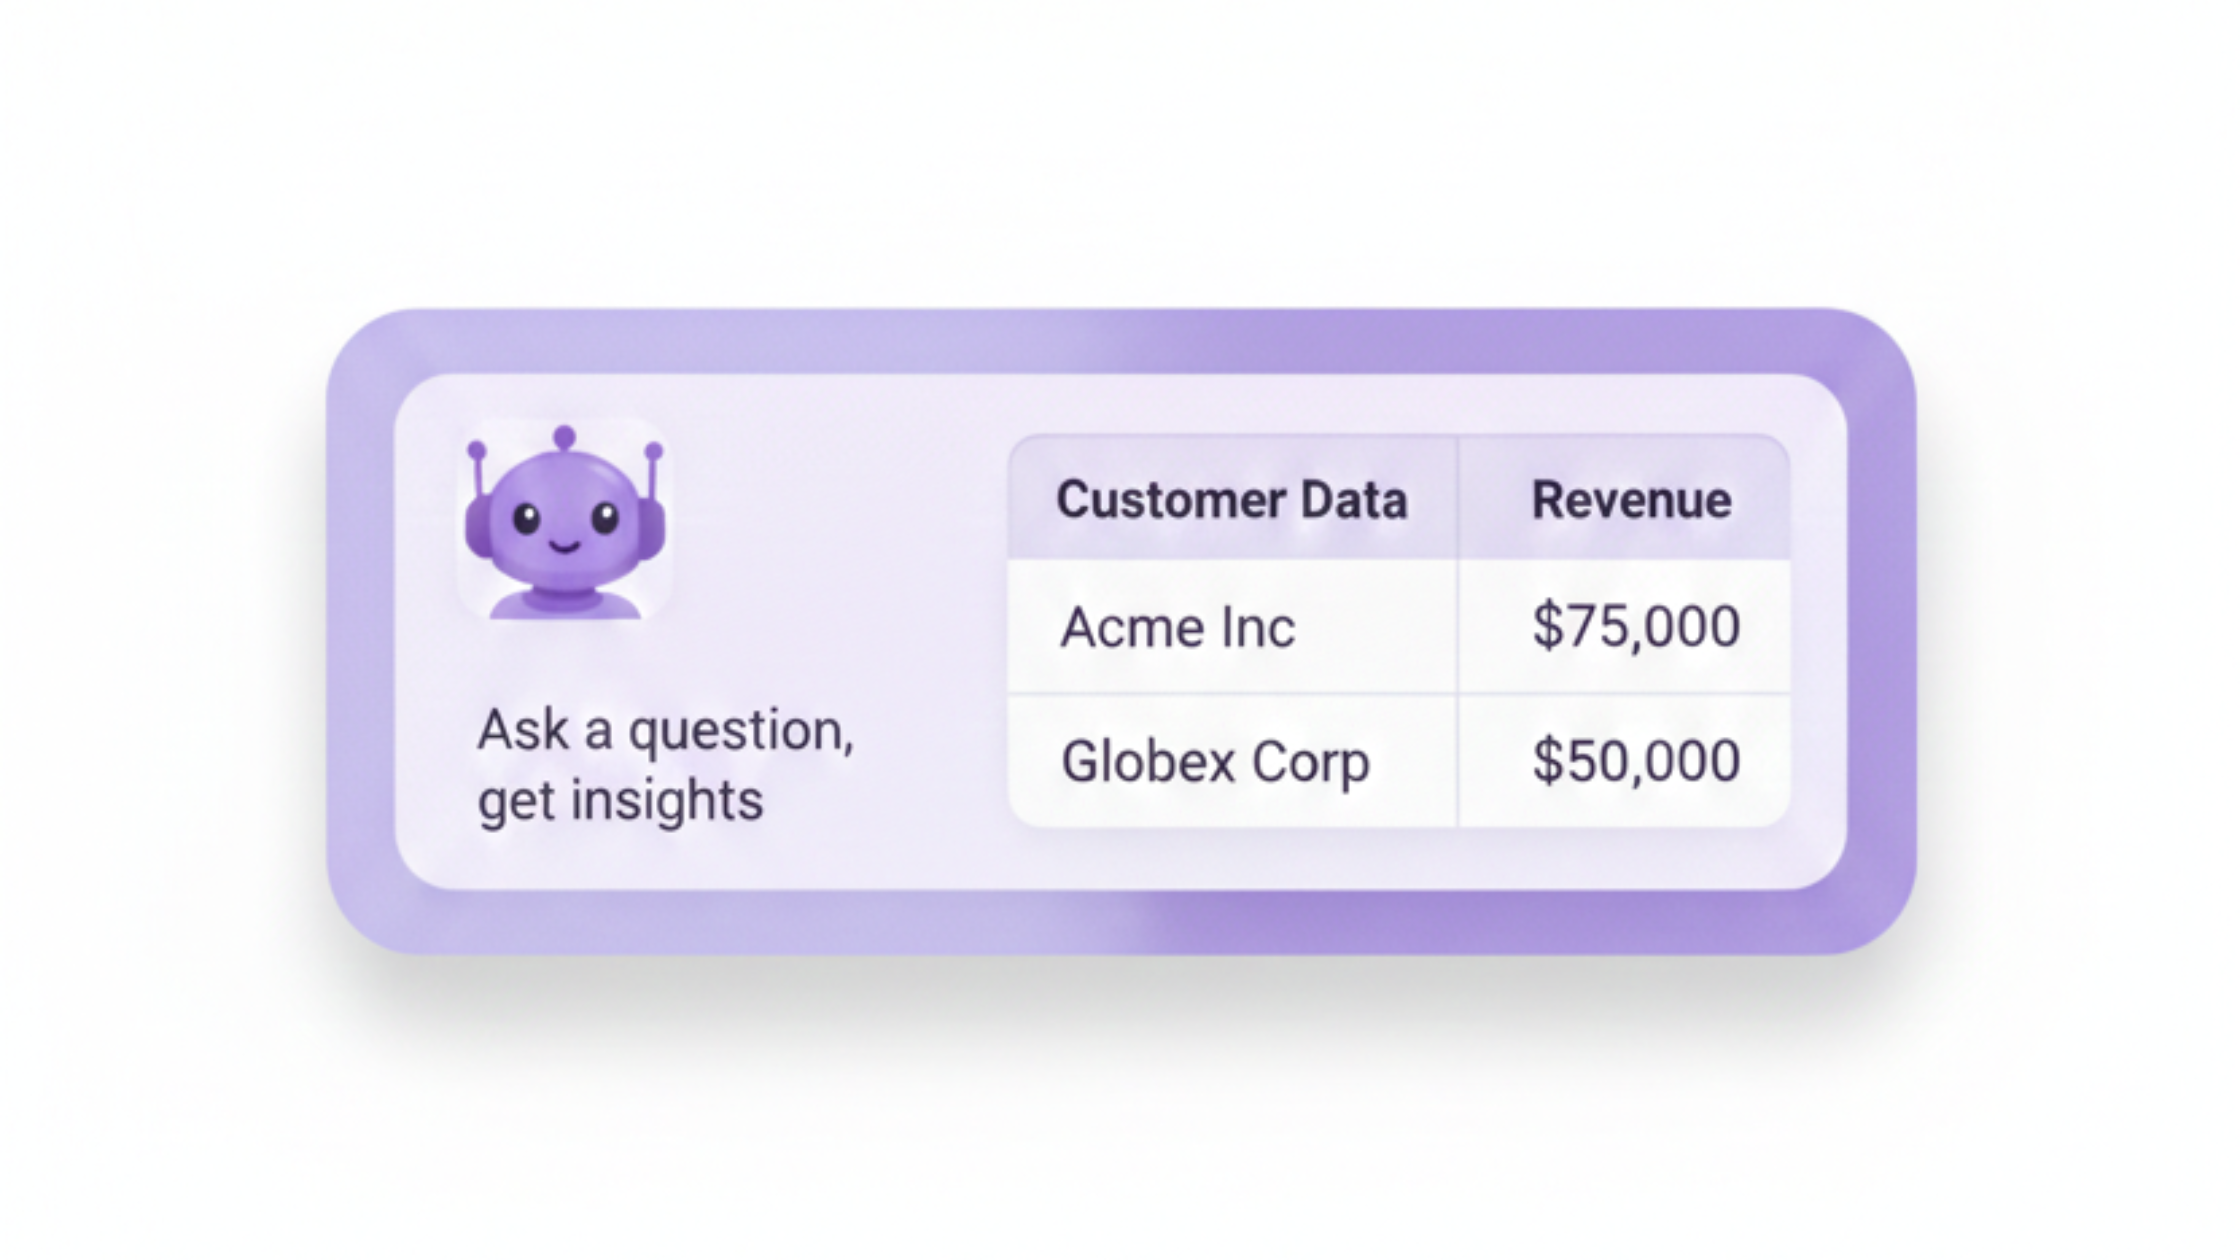
Chartsy takes a different approach to ecommerce analytics. Instead of fixed dashboards, it lets store owners ask questions in plain English and get actionable insights instantly.
With Chartsy, the store owner could:
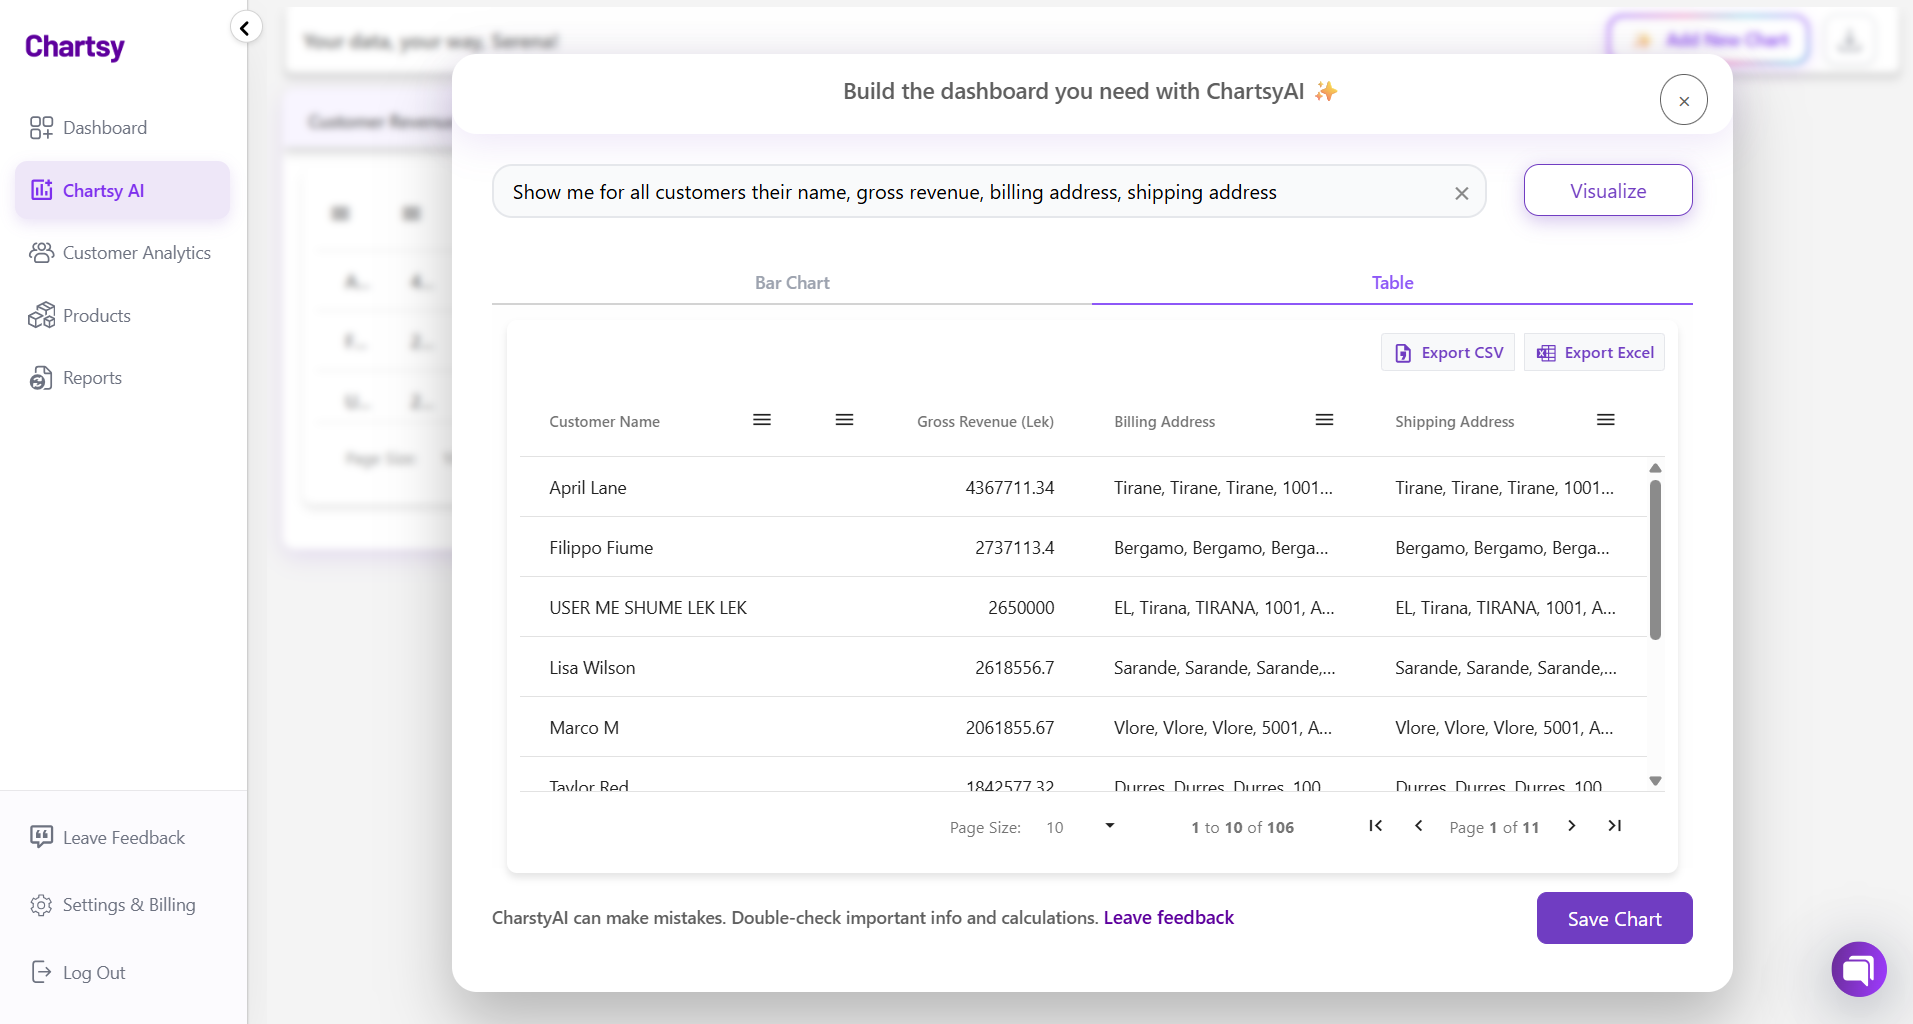
- Query data like:
“Show me for all customers, their name, gross revenue, billing address, shipping address” - Slice data monthly, quarterly, or by custom periods
- Identify new, active, or inactive customers
- Export results to CSV or Excel
- Save results as charts or dashboards
After a quick iteration, the store ran the report again - this time seeing full business names, billing addresses, and
revenue, and exploring additional insights like customers who hadn’t ordered in the past three months.
The Results
The impact was immediate:
- Full visibility into B2B customer data
- Faster reporting without relying on a developer
- Ability to analyze revenue trends and customer activity
- Empowered the team to make data-driven decisions efficiently
“Chartsy has been very VERY helpful. We’ll be adding more reports and using this website regularly. A very good value and very helpful.”
Key Takeaways for BigCommerce Stores
From this example, it’s clear that many BigCommerce businesses:
- Struggle with reporting limitations for B2B data
- Want easy customer data extraction without technical overhead
- Need flexible analytics to explore trends and segments quickly
- Benefit from tools that support monthly/quarterly segmentation, new/inactive customer tracking, and order-level drill-down
How Chartsy Can Help BigCommerce Stores
Chartsy helps BigCommerce stores turn raw data into actionable insights:
- Explore your data easily: Ask questions in plain English, no APIs required
- Custom reports and dashboards: Slice by month, quarter, product, or customer segment
- Track revenue trends and customer behavior: Identify new, active, or inactive customers instantly
- Export and share insights: Download CSVs or create dashboards for your team
- Save time and reduce manual work: Spend less time juggling spreadsheets and more time making decisions
Whether you want to analyze B2B customer data, track revenue trends, or get deeper insights into your BigCommerce store, Chartsy for BigCommerce gives you the tools to understand your business faster and smarter.

Written by
Chartsy TeamThe Chartsy Team writes guides, product updates, and resources to help SaaS and eCommerce founders make sense of their metrics, without SQL or spreadsheets.
Chartsy