
If you're running a BigCommerce store, you already have access to an analytics dashboard. Revenue charts, order counts, top products - it's all there.
But if you've ever tried to answer a slightly deeper question - like what is my customer lifetime value? or which customer cohort is churning fastest? - you've probably hit a wall.
The reality is that BigCommerce analytics was designed to provide quick summaries, not deep business insights. For early-stage stores, the built-in reports are helpful. But as your store grows, you need better visibility into customer behavior, revenue trends, and retention metrics.
In this guide, we'll break down:
- What BigCommerce built-in analytics actually provides
- The key metrics it doesn't track
- Signs that you've outgrown the native BigCommerce dashboard
- The best options for upgrading your ecommerce analytics tool
By the end, you'll know whether BigCommerce reporting is enough for your store - and what to do if it isn't.
What BigCommerce Analytics Actually Gives You
BigCommerce includes a built-in reporting suite available under Analytics in the store admin panel.
This dashboard provides several categories of reports designed to help merchants monitor store performance.
BigCommerce Analytics Dashboard Reports
| Report Category | What It Shows |
|---|---|
| Dashboard | Revenue, orders, conversion rate, and average order value |
| Merchandising | Product and category performance |
| Marketing | Traffic sources and coupon usage |
| Search | On-site search terms and results |
| Customers | New vs. returning customers and geographic breakdown |
| Abandoned Carts | Cart abandonment rate and value |
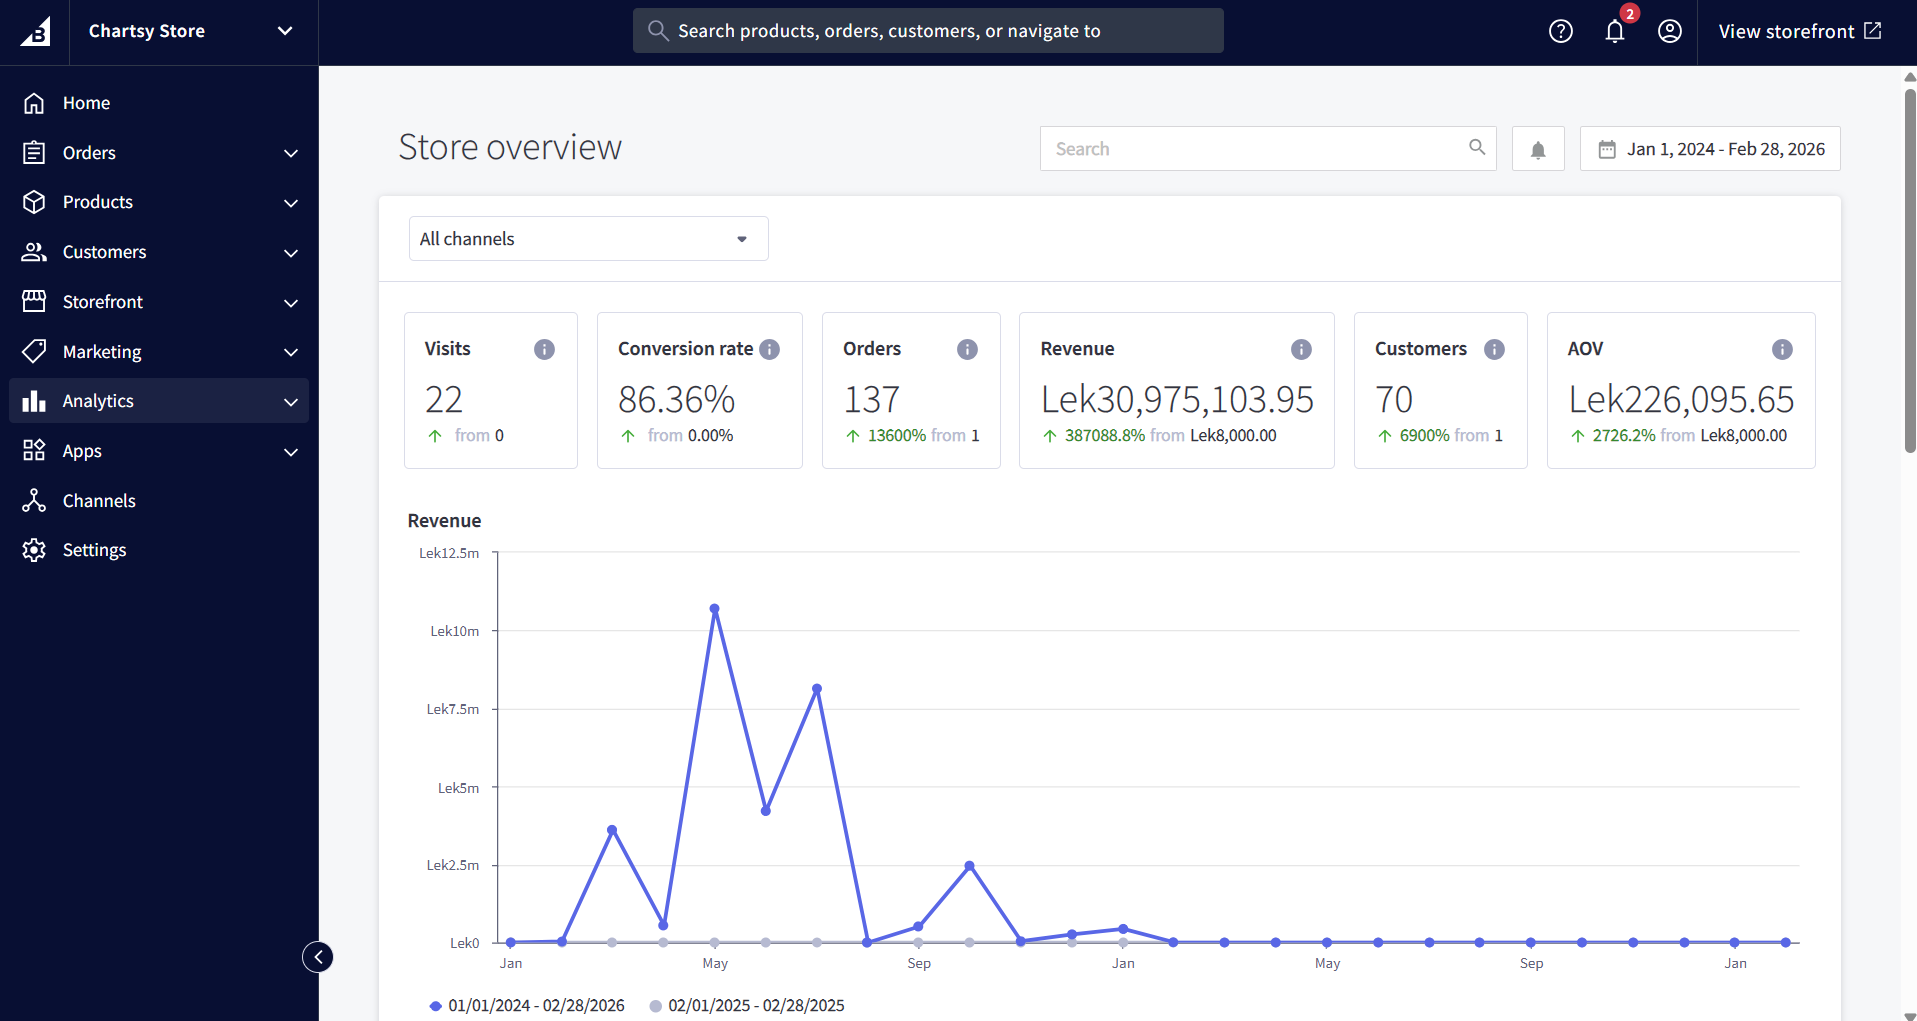 Figure 1: The standard BigCommerce Analytics overview provides high-level order data but lacks deep cohort-based
insights.
Figure 1: The standard BigCommerce Analytics overview provides high-level order data but lacks deep cohort-based
insights.
For new merchants, this is usually enough to get started. You can quickly answer questions like:
- Which products are selling the most?
- Where is my traffic coming from?
- Are my discount campaigns working?
- What is my store's daily revenue?
These insights are useful for operational monitoring. But once a store begins scaling, these reports quickly start to feel limited.
What BigCommerce Analytics Doesn't Include
The biggest limitation of BigCommerce reporting is that it focuses on surface-level metrics rather than the deeper indicators that drive long-term growth.
Here's a side-by-side comparison between BigCommerce built-in analytics and what a dedicated ecommerce analytics tool can provide.
| Feature | BigCommerce Built-in Analytics | Dedicated Analytics Tool (e.g., Chartsy) | |-|--|| | Revenue dashboard | ✅ Basic | ✅ Advanced + AI insights | | Customer lifetime value (LTV) | ❌ Not available | ✅ Per-customer & segment LTV | | Cohort analysis | ❌ Not available | ✅ Retention by signup month | | Churn rate | ❌ Not available | ✅ Subscription & repeat buyer churn | | Natural language queries | ❌ Not available | ✅ Ask questions in plain English | | Custom dashboards | ⚠️ Limited widget builder | ✅ Fully customizable | | Product performance deep-dive | ⚠️ Basic top products list | ✅ Revenue, margin, velocity | | Refund & dispute tracking | ⚠️ Order-level only | ✅ Aggregate trends & alerts | | Automated reports | ❌ Not available | ✅ Scheduled weekly reports |
These gaps matter more than they might seem.
Once a store surpasses roughly $10K/month in revenue, the metrics that matter most change. Merchants start asking questions like:
- What is my customer lifetime value?
- Which acquisition channels bring the best customers?
- Are newer customers retaining better or worse than previous ones?
- Which products drive repeat purchases?
Unfortunately, BigCommerce's built-in analytics simply doesn't answer these questions.
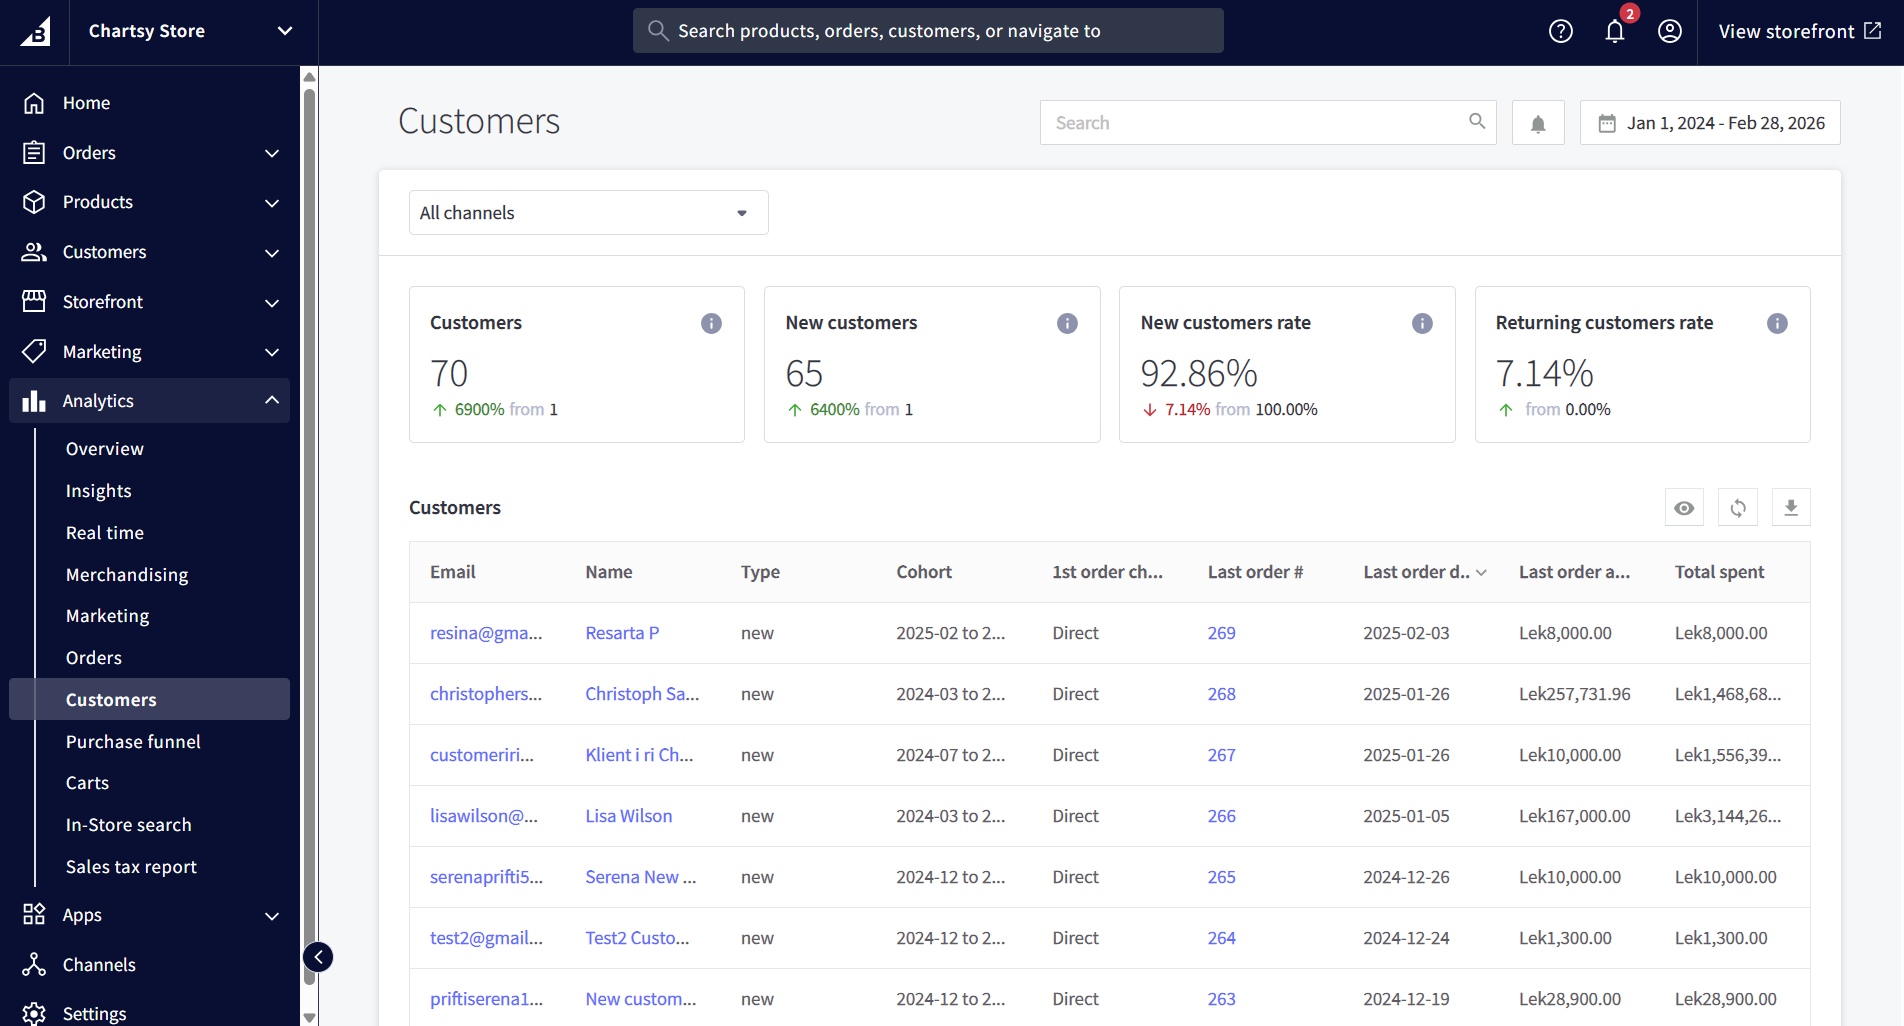 Figure 2: BigCommerce's 'Customers' report shows total spend, but lacks the time-bound cohort data needed for true LTV calculation.
5 Signs You've Outgrown BigCommerce Analytics
Many merchants don't realize they've outgrown their analytics until reporting becomes a weekly headache.
Here are the most common warning signs.
| Warning Sign | What It Means |
|---|---|
| You export reports to Excel every week | You're building reports manually instead of seeing them automatically |
| You can't answer “what’s my churn rate?” | BigCommerce doesn’t track this metric |
| You don't know your customer LTV | Without LTV you can't optimize ad spend |
| Your team constantly asks for numbers | Lack of self-serve dashboards creates bottlenecks |
| You find problems only after customers complain | No automated monitoring or anomaly alerts |
If two or more of these apply to your store, you're likely spending more time managing data than learning from it.
The Real Cost of Relying on Built-in Analytics
Limited analytics isn't just inconvenient - it can directly impact profitability.
Here are a few common ways this happens.
Overspending on Ads
Without knowing your customer lifetime value by acquisition channel, it's impossible to calculate true return on ad spend.
For example:
- You might spend $50 to acquire a customer
- But that customer may only generate $45 in lifetime revenue
Without LTV insights, this loss remains invisible.
Inventory Blind Spots
Basic product reports show top sellers, but they don't show:
- Product sales velocity trends
- Margin-adjusted product rankings
- Changes in repeat purchase rates
These signals are critical for preventing stockouts and overstocking.
Retention Guesswork
BigCommerce provides a repeat customer rate, but this metric alone doesn't show whether retention is improving.
Cohort analysis is needed to answer questions like:
- Are customers acquired in January retaining better than February?
- Did a pricing change affect retention?
- Which acquisition channels bring loyal customers vs one-time buyers?
Without cohort analytics, retention trends remain hidden.
Delayed Decision Making
When every analysis requires:
- Exporting a CSV
- Cleaning data in Excel
- Building formulas
- Sharing spreadsheets
…decisions slow down.
In ecommerce, where pricing, ads, and inventory decisions happen daily, delayed insights can create a real competitive disadvantage.
What to Do Instead: Your Options
If you've reached the limits of BigCommerce analytics, there are several paths forward depending on your technical resources.
Option 1: Hire a Data Analyst
A dedicated data analyst can build custom reports and dashboards from your BigCommerce data.
Pros
- Fully customized analytics
- Advanced analysis possible
Cons
- Expensive (typically $60K–$120K per year)
- Requires onboarding and ongoing management
- Still dependent on one person for insights
For large ecommerce companies, this can be worthwhile. For most growing stores, it's overkill.
Option 2: Use Google Looker Studio or Power BI
Visualization tools like Google Looker Studio or Microsoft Power BI can connect to BigCommerce using third-party connectors.
Pros
- Flexible dashboards
- Powerful visualization tools
Cons
- Setup can take weeks
- Requires technical skills
- Metrics like LTV and churn must be defined manually
These tools are powerful but require significant setup and maintenance.
Option 3: Use a Dedicated Ecommerce Analytics Platform
The fastest option for most merchants is using a purpose-built ecommerce analytics tool.
Platforms like Chartsy connect directly to BigCommerce and automatically calculate metrics such as:
- Customer lifetime value
- Cohort retention
- Monthly recurring revenue (MRR)
- Churn rate
- Revenue trends
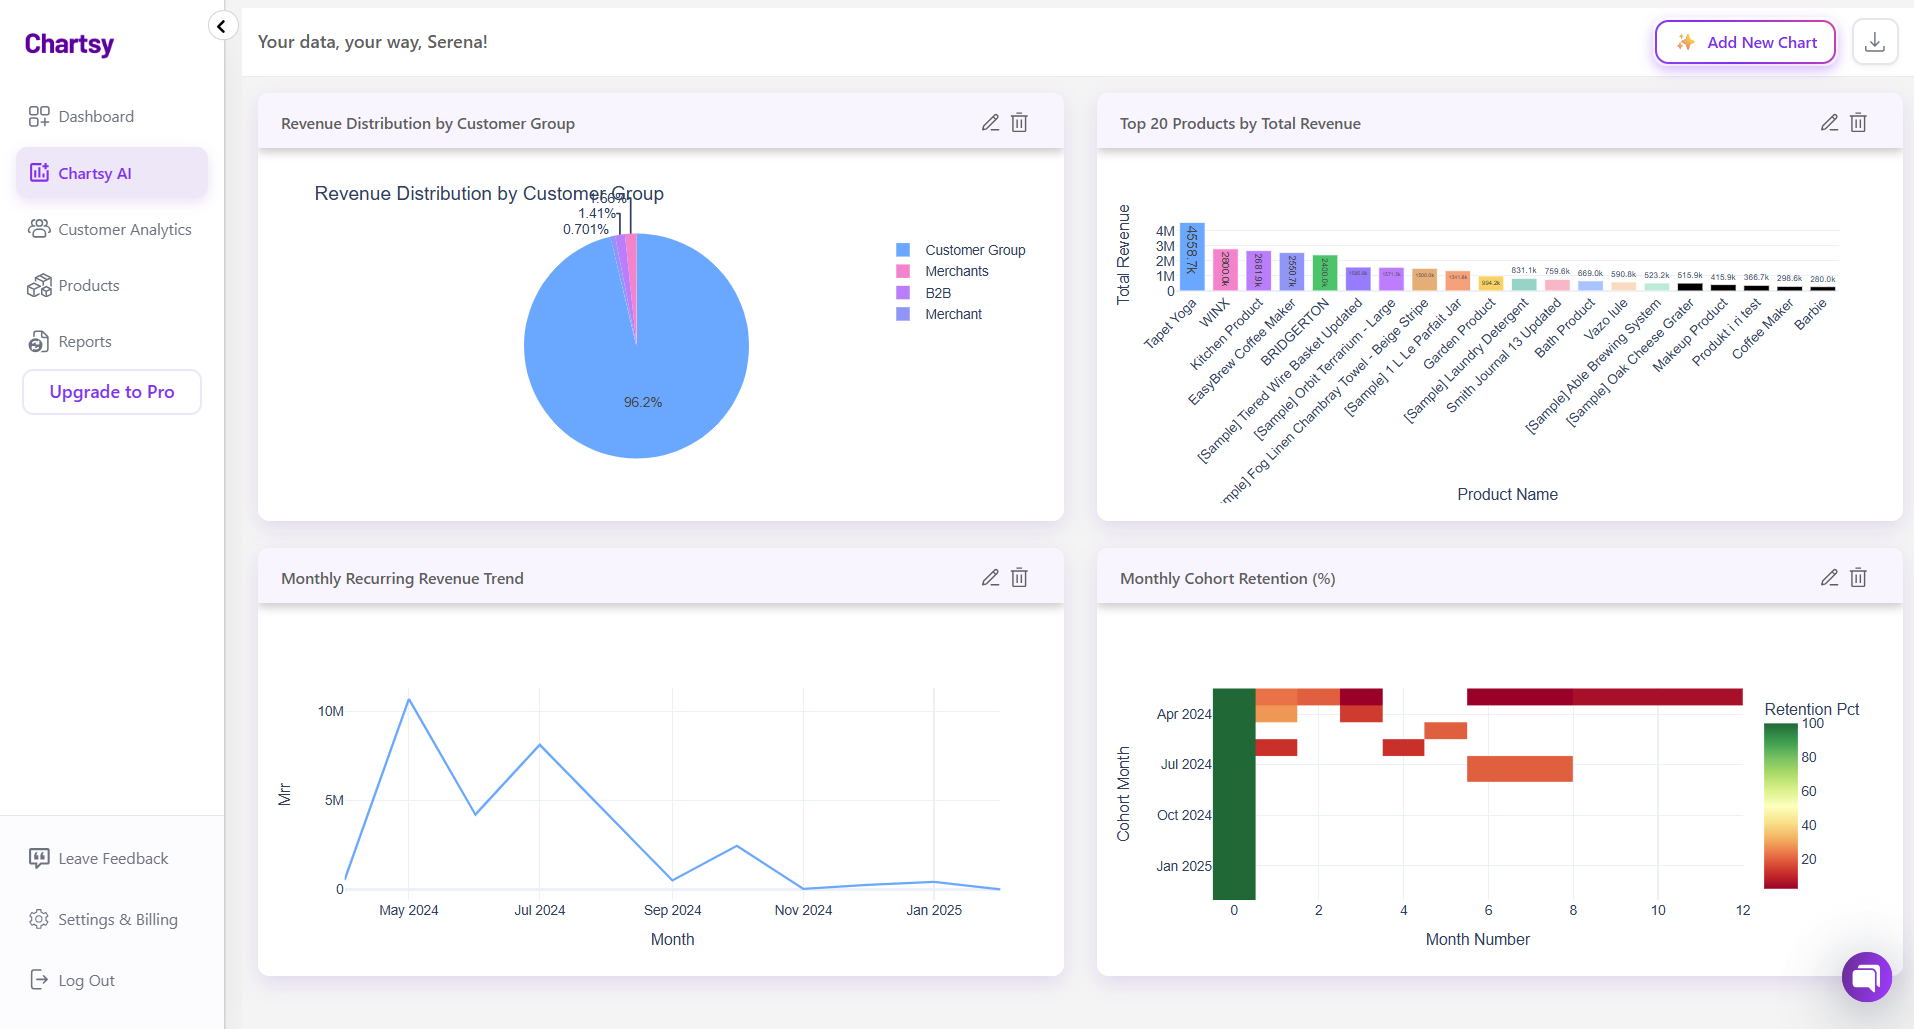 Figure 3: Chartsy surfaces the deep ecommerce insights that BigCommerce misses, organized for growth-stage teams.
Instead of exporting spreadsheets or writing SQL queries, you can simply ask questions like:
- “What’s my LTV by acquisition channel?”
- “Which product drives the most repeat purchases?”
- “Which customer cohort has the highest retention?”
And receive an instant answer.
For most growing ecommerce businesses, this approach delivers the fastest path to data-driven decision making.
The Bottom Line
BigCommerce built-in analytics is a starting point - not a complete analytics strategy.
It gives merchants a quick overview of store performance, but it doesn't provide the deeper insights needed to optimize acquisition, retention, and profitability as your business grows.
If you're spending more time exporting spreadsheets than analyzing your business, it's a clear signal that it's time to upgrade your analytics stack.
Tools like Chartsy connect to BigCommerce in minutes, automatically calculate the metrics that matter, and let your entire team explore insights without needing SQL or complex reporting workflows.
If better data leads to better decisions, better analytics tools lead to faster growth.

Written by
Serena PriftiSerena Prifti is the founder of Chartsy and writes about analytics, growth, and subscription metrics. She focuses on helping founders and operators turn raw data into clear insights that drive better decisions.
Serena Prifti