Struggling to decode your Stripe data? Manual spreadsheets and complex SQL queries waste time and obscure the very insights you need to scale your business. In 2025, founders shouldn't be fighting with CSV exports just to see their growth trajectory.
With Chartsy, you can transform your Stripe subscription, revenue, and customer data into powerful, no-code Stripe analytics dashboard visualizations in seconds. In this post, we'll explore how Chartsy's AI-powered SaaS analytics simplifies tracking key metrics like MRR, churn, and discount performance-without the "technical tax" usually required for deep data exploration.
What is a Stripe Analytics Dashboard?
A Stripe analytics dashboard is a specialized Business Intelligence (BI) tool that connects directly to your Stripe account to calculate and visualize SaaS-specific metrics like Monthly Recurring Revenue (MRR), Churn Rate, and Lifetime Value (LTV). Unlike the basic reporting found in the Stripe dashboard, these tools provide the diagnostic depth needed to understand why your revenue is moving.
Why Stripe Analytics Matter for SaaS Businesses
Stripe is the gold standard for payment processing, but its built-in reporting often lacks the granular diagnostic capabilities needed for strategic growth. Extracting actionable data shouldn't require a data engineering degree.
Founder's Insight: "Based on real-world use cases, the biggest barrier to growth isn't a lack of data-it's the 'time-to-insight.' If it takes two hours to build a churn report, you won't do it often enough to catch leaks before they become floods." - Serena Prifti, Founder of Chartsy
Key SaaS Metrics to Track in 2025
To supercharge your growth, your dashboard must prioritize these four areas:
- SaaS Monthly Revenue Trends: Identify seasonal patterns to optimize your runway.
- Subscription Plan Performance: See which tiers drive the most expansion revenue.
- High-Value Customer Health: Retain your top revenue drivers with proactive outreach.
- Discount Code ROI: Track which promotions attract long-term loyalists vs. one-month churners.
Visualize SaaS Monthly Revenue Trends
Tracking revenue trends helps you plan your next hire or ad spend with confidence. Instead of writing a script, simply ask Chartsy: "Show me my sales by month for the last year."
 Figure 1: Automated revenue trend visualization generated via Chartsy's natural language interface.
Chartsy generates a sleek line graph instantly. This chart doesn't just show a number; it shows your momentum. You can download these as a PNG for your investor decks or PDFs for internal team syncs.
Discover Top Subscription Plans Analytics
Which plan is actually your "bread and butter"? Understanding which subscription plans resonate with customers allows you to optimize your offerings. A Stripe query might reveal:
- Pro Plan: High growth, high retention.
- Basic Plan: High volume, lower LTV.
- Enterprise Plan: Bespoke revenue drivers.
Ask Chartsy: "What are my most popular subscription plans this month?" The AI scans your Stripe metadata and provides an instant bar chart. This insight lets you amplify high-performing plans or refine others to track SaaS subscriptions effortlessly.
Identify High-Value SaaS Customers
Retention is the most important lever in SaaS growth. Identifying your top subscribers allows you to personalize outreach and reduce "silent churn."
With Chartsy, ask: "Who are my top 10 subscribers by revenue?" You get a clear list of your most critical partners. Use this data to trigger proactive support check-ins or exclusive loyalty offers. Use the table below to see how Chartsy compares to other methods of data extraction:
| Feature | Manual Spreadsheets | Stripe Sigma (SQL) | Chartsy (AI Dashboard) |
|---|---|---|---|
| Setup Time | Hours/Days | Moderate | < 2 Minutes |
| Ease of Use | Hard | Technical | Conversational |
| Real-Time Data | ❌ No | ✅ Yes | ✅ Yes |
| Visualizations | Manual | Manual/SQL | Automated |
Optimize Discount Code Performance
Strategic discounts can skyrocket sales, but only if they don't destroy your long-term margins. Ask Chartsy: "What are my best-performing discount codes?"
Chartsy identifies which codes (like SAVE25 or FREETRIAL) are driving high-LTV customers. Focus on high-ROI promotions to maximize revenue without devaluing your brand.
How Chartsy Simplifies Stripe Analytics
Chartsy's AI-powered platform makes Stripe analytics effortless through a simple four-step process:
- Connect Your Stripe: Secure, one-click OAuth integration.
- Ask in Plain English: No SQL-just type your question like you're talking to an analyst.
- Get Instant Visualizations: Beautiful, accurate charts in seconds.
- Save & Share: Pin to your dashboard or export for presentations.
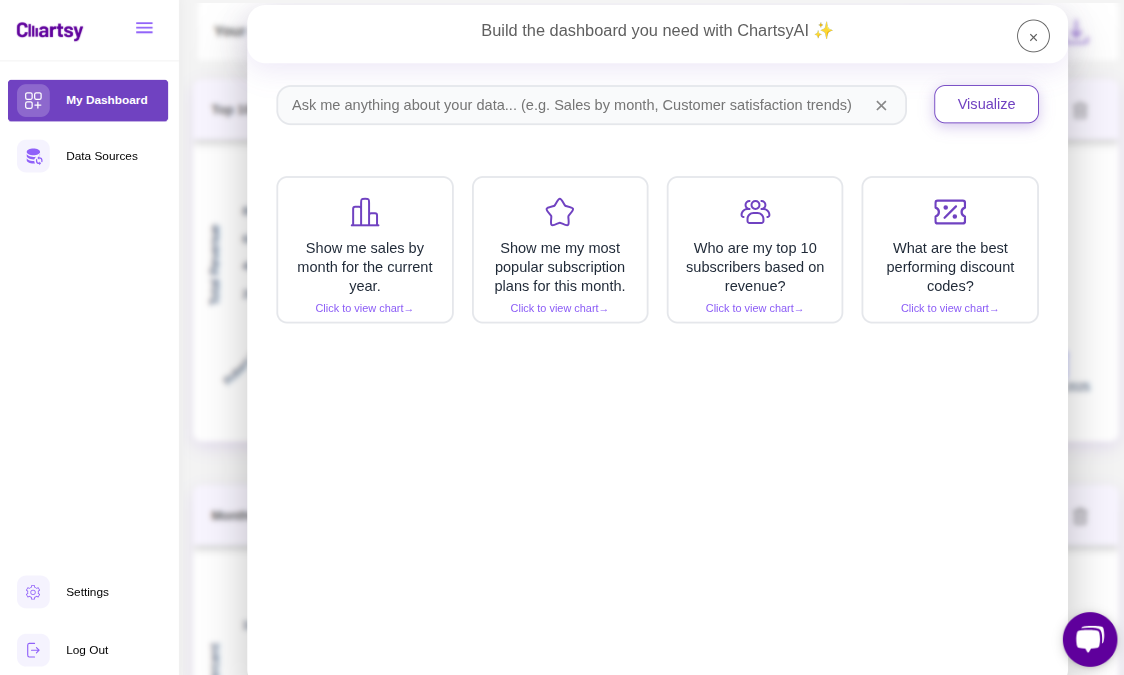 Figure 2: The Chartsy dashboard brings your Stripe data to life with zero manual configuration.
FAQ: Stripe Analytics for SaaS
How is Chartsy different from Stripe Sigma?
Stripe Sigma is a powerful tool but requires SQL knowledge. Chartsy provides the same depth of data but uses a no-code, conversational AI interface, making it accessible to marketing, sales, and leadership teams.
Can I track churn rate in Chartsy?
Yes. Chartsy automatically calculates both user churn and revenue churn. You can even ask the AI to "Show me churn by acquisition channel" to find where your most loyal customers come from.
Is my data safe when connecting Stripe?
Absolutely. Chartsy uses enterprise-grade encryption and restricted API access via Stripe's official OAuth flow. We never see your customers' full credit card details.
Conclusion
The era of clicking through twenty different tabs to find one metric is over. With Chartsy’s Stripe analytics dashboard, your metrics are finally as mobile and conversational as your team. Whether you are prepping for a board meeting or checking your morning growth, the answers are now just one sentence away.
Ready to talk to your data? Log in to your Chartsy Dashboard today and ask your first question.

Written by
Chartsy TeamThe Chartsy Team writes guides, product updates, and resources to help SaaS and eCommerce founders make sense of their metrics, without SQL or spreadsheets.
Chartsy