
You open your dashboard and see the familiar pattern: traffic is up, signups look healthy, and the team has plenty of charts to discuss. Then you check MRR and find that it hasn't moved in the same direction. Someone asks which campaign brought the new customers, which plan is expanding, and whether recent churn came from one acquisition channel. Your analytics setup can't answer without several exports and a spreadsheet.
That gap is the core SaaS funnel analytics problem. A signup is an intent signal, not revenue. For a subscription business, useful analysis follows the account from marketing source to signup, payment, renewal, upgrade, downgrade, or cancellation. Once those events share an account identity, growth decisions become less about traffic volume and more about the customers and recurring revenue each source produces.
Table of Contents
- Why SaaS Funnel Analytics Is Different
- The Four Pillars of MRR Change
- Connecting Traffic to Revenue Attribution
- Finding Where the Funnel Leaks
- Tools for Small Teams Without Analysts
- Common Pitfalls to Avoid
- Your Next Steps for Better Analytics
Why SaaS Funnel Analytics Is Different
Traditional web analytics is good at answering questions about visits. It can show landing pages, referral sources, campaign traffic, and conversion events. It usually becomes much less useful after a visitor starts a trial or creates an account. The platform may record a signup, but it doesn't automatically tell you whether that person paid, which plan they chose, or whether the subscription remained active.
That limitation matters because SaaS revenue arrives across a lifecycle. A customer may begin with a trial, convert to a paid plan, expand seats, downgrade later, or cancel. A channel that produces many signups can perform worse than a quieter channel if its customers fail to activate or churn soon after conversion. Looking only at acquisition activity hides that difference.
A practical definition of SaaS funnel analytics is the connection between where an account came from and what happened to its subscription afterward. That means joining marketing data with product or signup events and billing records, then examining the path by source, plan, customer, and cohort.
Start with the revenue question
Before adding another dashboard, write down the question you need answered. “How many visitors did paid search bring?” is useful for campaign monitoring, but it isn't enough for a subscription business. Better questions include:
- Paying customers: Which sources produced customers who started paying?
- Recurring revenue: Which sources contributed to current MRR, rather than only initial signups?
- Retention: Which cohorts remained subscribed, expanded, downgraded, or churned?
- Funnel leakage: Did accounts disappear before activation, during the trial, or after payment?
The answers belong alongside your broader SaaS metrics, not in a separate marketing report that finance and operations can't reconcile.
Why signup growth can mislead
Suppose content marketing brings in qualified visitors who sign up slowly but convert to paid plans. A campaign may generate more immediate registrations while attracting users who never reach a meaningful product action. Both channels look successful in a signup report. Only a revenue-linked view shows which one deserves more investment.
SaaS funnel analytics also changes how you interpret experiments. A pricing page test can increase trial starts while reducing paid conversion. An onboarding improvement can leave signup volume unchanged while increasing the number of accounts that reach payment. The right result isn't always the biggest movement at the top of the funnel. It's the movement that improves the subscription path without damaging retention.
The Four Pillars of MRR Change
MRR is an outcome, not an explanation. When it rises or falls, you need to know which customer movements caused the change. In subscription businesses, the usual building blocks are new MRR, expansion MRR, contraction MRR, and churned MRR, as described in this breakdown of MRR mechanics.
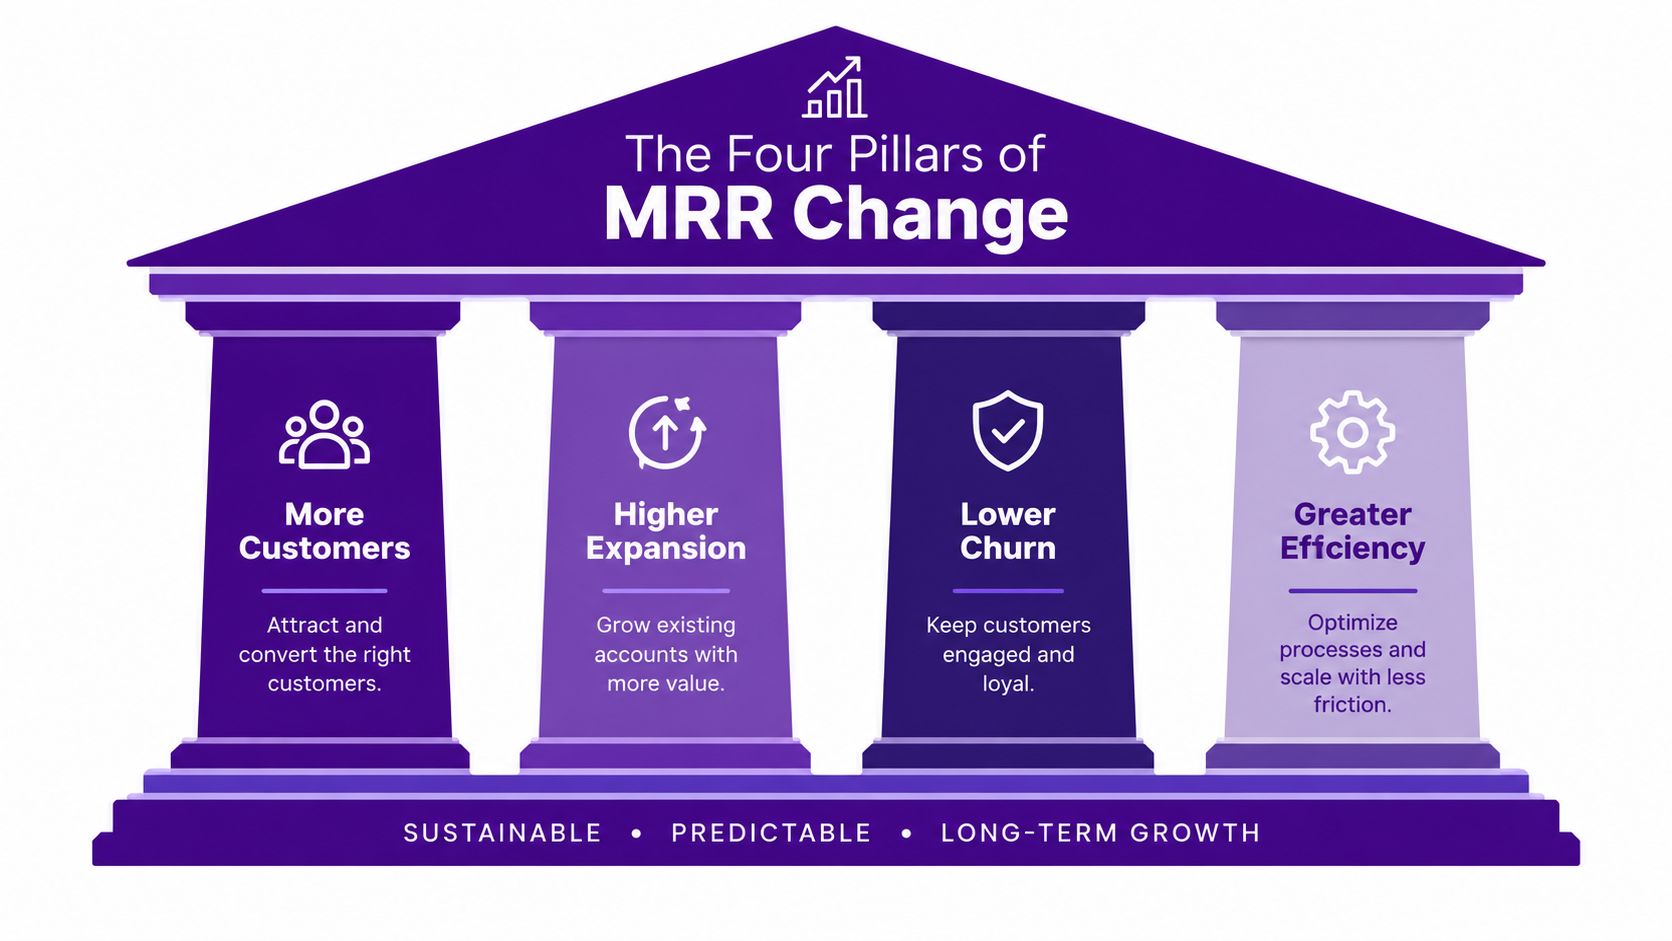
New MRR comes from first-time paying customers. It reflects acquisition and conversion, but not necessarily acquisition quality. If a source produces new subscriptions, it contributes to this category even if those customers later cancel. That makes new MRR useful for measuring initial growth, but insufficient for judging the full value of a channel.
Expansion MRR comes from existing customers paying more. An upgrade, additional seats, or a higher plan can increase the recurring value of an account without creating a new customer. For a small SaaS company, expansion can compensate for slower new-customer acquisition, but only if the product gives existing customers a reason to grow.
Contraction MRR comes from downgrades. It signals that an account is still active but now contributes less recurring revenue. Contraction can point to pricing pressure, reduced usage, a change in customer needs, or a plan structure that doesn't match how customers buy. The billing record shows the movement, but it doesn't prove the reason.
Churned MRR comes from cancellations. It removes recurring revenue and should be analyzed separately from downgrades because the commercial response differs. A downgrade may call for packaging or expansion work. A cancellation may require better retention research, although attribution data alone can't establish why an individual customer left.
Practical rule: Never celebrate higher MRR without checking whether new customers, upgrades, lower downgrades, or reduced cancellations produced it.
A simple MRR dashboard that shows only the net change compresses all four mechanics into one figure. That can make a weak business look stable. For example, expansion from established accounts might offset churn from a newly acquired cohort. The total is flat, but the acquisition channel and customer segment may be deteriorating. Breaking the movement into its components gives you a more useful diagnostic vocabulary.
Connecting Traffic to Revenue Attribution
The connection starts before signup. Capture the source that brought the visitor to your site, preserve it when the visitor creates an account, and make sure the account can later be matched to its billing record. The practical principle is simple: SaaS revenue attribution should connect a marketing source to the subscription revenue and retention that source produces, not just to the original click or signup, as outlined in this guide to SaaS revenue attribution.
Preserve the first-touch context
Use consistent UTM parameters for campaigns and make sure the source data survives the signup flow. At minimum, you want a durable record of the first-touch source associated with the account. If the visitor arrives through a campaign, signs up later from a bookmarked page, and then pays from inside the application, last-touch reporting may label the account as direct. That loses the original acquisition context.
First touch isn't automatically the truth about causation. It tells you where the recorded journey began. A customer may have encountered your brand through several channels before paying, so treat attribution as an analytical model, not proof that one campaign alone created the subscription.
Match accounts to billing
Next, connect the application account or customer identifier to the billing customer in Stripe, Paddle Billing, or Paddle Classic. The identifier must be stable enough to prevent duplicate customer records and should remain available when a subscription changes. Without that link, marketing data and billing data remain two separate stories.
The useful journey then looks something like this:
- Marketing source: A visitor arrives with a campaign or referral source.
- Signup record: The visitor creates an account, and the source is stored with that account.
- Billing match: The account is associated with its Stripe or Paddle customer record.
- Subscription event: The account starts paying, changes plans, or cancels.
- Revenue rollup: MRR and retention outcomes are grouped by the original source and relevant cohort.
The exact event names will differ between products. The principle doesn't. You need enough identity continuity to connect a website visit with the account that eventually generated recurring revenue.
Report outcomes by source
Once the records are joined, stop treating “conversions” as one category. Break the report into signups, paying customers, current MRR, subscription movements, and churn. A source with fewer signups may produce more current MRR because its customers choose higher plans or remain active longer. A source with strong signup volume may produce little recurring revenue if accounts never pay.
Separate observed facts from assumptions. You can say that a channel is associated with paying customers from a particular cohort. You can't claim that the channel caused every payment unless your measurement design supports that conclusion. This distinction keeps attribution useful without turning a dashboard into an overconfident explanation of customer behavior.
Finding Where the Funnel Leaks
A funnel leak is not always the point with the lowest conversion rate. It's the point where a meaningful group of qualified accounts stops progressing, especially when that drop-off repeats across cohorts or sources. A useful analysis compares the journey by acquisition source and follows each cohort after signup instead of blending every account into one lifetime average.
Start with a small set of stages: visitor to signup, signup to activation, activation to paid, and paid to retained. Add stages only when they answer a real operating question. If your report contains every click but no clear decision, you've built an event inventory, not a diagnostic funnel.
Read the conversion baseline carefully
Free-trial design can change the expected shape of the funnel. One widely cited SaaS benchmark reports 18.2% average conversion from opt-in free trials to paid, while opt-out trials requiring a card upfront convert at 48.8%, according to this SaaS funnel analytics benchmark summary. These figures aren't targets to copy blindly. They show why trial mechanics, user intent, payment friction, and audience quality must be considered together.
A trial-to-paid rate that looks weak may reflect a low-intent acquisition source, poor activation, unclear value, or a trial design that attracts broad exploration. A high rate may reflect stronger commitment at signup rather than better onboarding. Compare like with like, and segment by source, plan, and trial type before deciding what needs fixing.
Use cohorts instead of blended averages
A cohort groups accounts by a shared starting point, such as signup month or acquisition source. Compare what happens to those accounts after signup:
- Early progression: Do they reach the activation event?
- Payment behavior: Do they become paying customers?
- Retention: Do subscriptions remain active?
- Revenue movement: Do accounts expand, contract, or churn?
Cohort resurrection is also worth tracking. A customer may cancel or become inactive and later return. If you only inspect a single churn total, you'll miss the difference between permanent loss and a subscription that was recovered. Resurrection doesn't erase the earlier churn, but it changes how you assess the long-term value of a cohort and the timing of reactivation work.
A funnel tells you where accounts stop. A cohort tells you whether that stopping point belongs to a temporary delay, a weak source, or a persistent customer-quality problem.
The practical workflow is to identify the largest drop, segment it by source and plan, and then inspect the next downstream revenue event. If activation is weak but paid conversion among activated accounts is healthy, improve onboarding. If payment is healthy but retention is poor, don't spend the next month optimizing signup volume. Investigate the customer and subscription patterns associated with churn.
Tools for Small Teams Without Analysts
Small SaaS teams often begin with a sensible setup: website analytics for visits, a signup database for accounts, Stripe or Paddle for billing, and a spreadsheet to join the exports. The problem isn't that any one tool is inadequate. The problem is that the joins become manual, inconsistent, and hard to reproduce when customer records or subscription states change.
A spreadsheet can answer a one-off question. It becomes fragile when you need the same report every week, especially when you must distinguish new customers from upgrades, downgrades, and cancellations. It also encourages teams to optimize the data that's easiest to export, usually visits and signups, rather than the data that matters most, such as current MRR by source.
Compare the operating choices
There are three practical approaches.
- Manual exports: Low initial cost and flexible for small investigations, but every refresh requires effort and creates opportunities for mismatched dates, duplicate accounts, or stale subscription states.
- General analytics tools: Useful for website behavior and campaign monitoring, but they often stop before billing and recurring revenue unless you build and maintain the data connection yourself.
- Purpose-built SaaS analytics: More focused on connecting acquisition, customers, and subscription outcomes. The trade-off is that you work within the platform's supported data model and integrations.
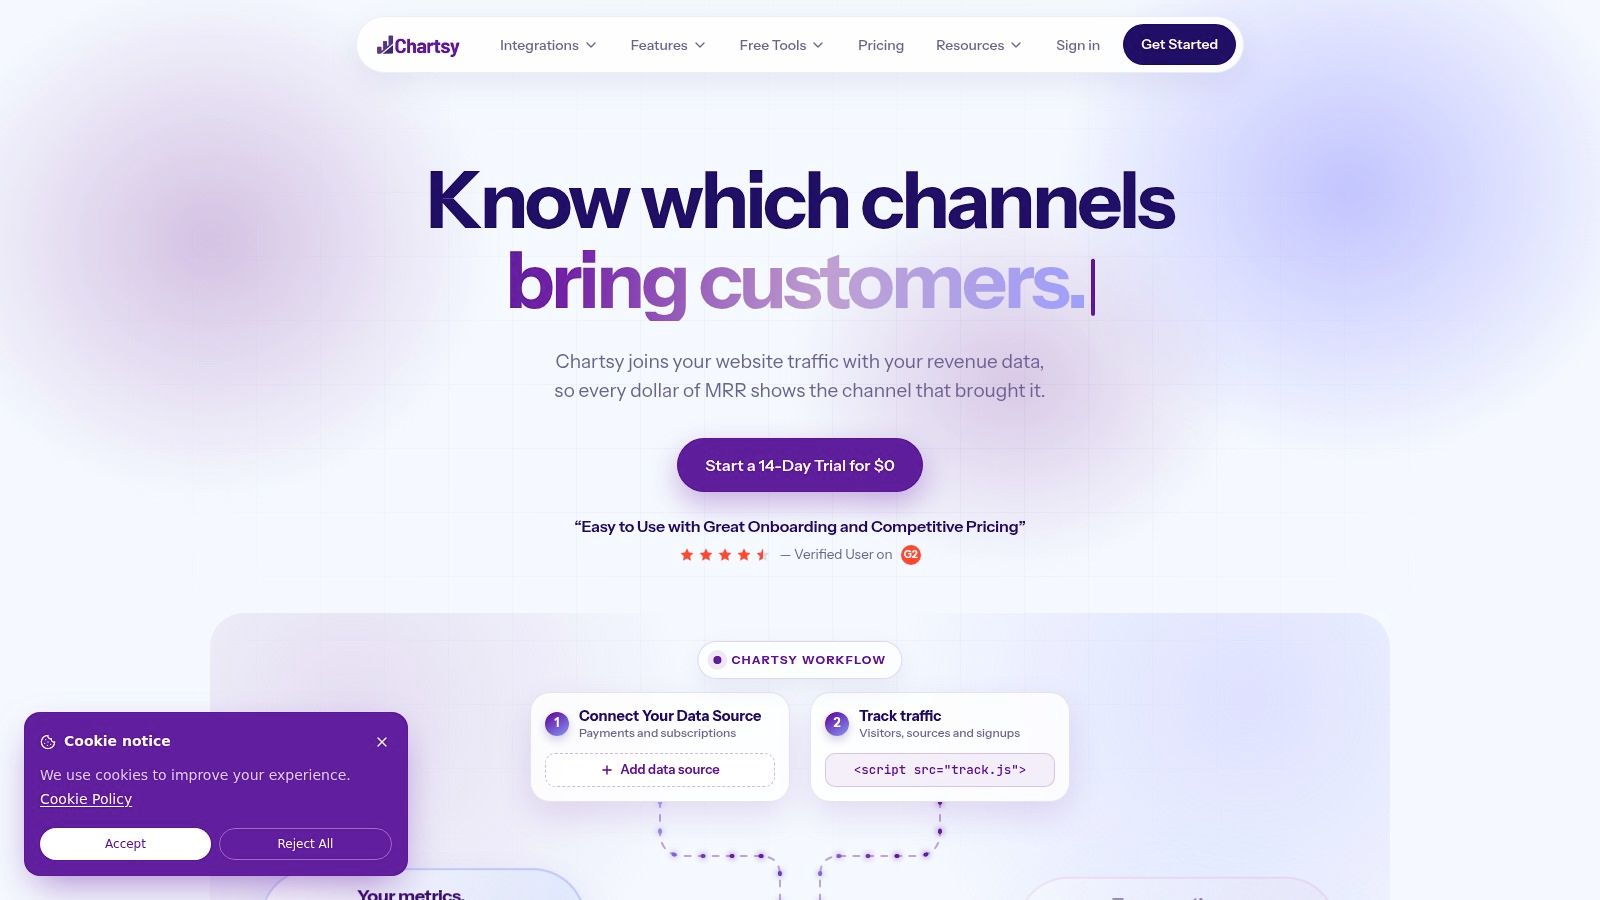
Chartsy is a SaaS analytics and revenue attribution platform for this third category. It connects website visits and signups with billing data from Stripe, Paddle Billing, and Paddle Classic, then supports analysis of marketing sources, customers, MRR, revenue, churn, and subscription movements. Its plain-English AI interface lets a founder ask questions about the data and create charts or tables without writing SQL. Relevant charts can be saved to dashboards for ongoing monitoring.
The broader reporting need is well described in this discussion of SaaS analytics tools: teams need to move beyond traffic and leads toward MRR, LTV, CAC payback, and marketing-sourced ARR, while small companies still struggle to connect website, signup, CRM, and billing data into one identity layer. A tool like Chartsy fits when the core problem is that acquisition and subscription reporting are disconnected, not when you need a full accounting system or a custom data warehouse.
A useful tool should also make uncertainty visible. If a source is associated with churn, the report should show the association and the underlying subscription movement. It shouldn't invent a reason for the cancellation. Read-only billing connections are valuable here because they allow analysis without changing the source billing data.
For teams evaluating options, test one concrete question rather than browsing feature lists. Ask, “Which source brought the paying customers who currently contribute MRR?” Then check whether the answer can be segmented by plan and cohort, refreshed without a spreadsheet, and understood by the person responsible for growth.
The following product walkthrough gives a visual reference for how a focused SaaS analytics workflow can bring these questions together.
Common Pitfalls to Avoid
The most expensive mistake is optimizing the metric that arrives first. Traffic and signups are visible quickly, while payment, retention, and MRR movements take longer to observe. If you reward the acquisition source with the most registrations before checking customer quality, you may increase workload without improving recurring revenue.
Last click is not the whole journey
Last-click attribution is easy to explain and often easy to implement. It can still misrepresent the path to purchase. A visitor may discover your product through an article, return through a branded search, and sign up through a direct visit. Assigning all credit to the final interaction makes the earlier source disappear.
First-touch attribution has its own limitation. It preserves the origin but doesn't prove that the first source caused the payment. Use source fields to describe the recorded customer journey, then compare revenue and retention outcomes across consistent cohorts. If the business question requires stronger causal evidence, you'll need a testing approach beyond ordinary attribution reporting.
Free trials are not MRR
A free account can be valuable for activation analysis, but it isn't paid recurring revenue. Stripe Billing guidance defines approximate MRR as the sum of monthly-normalized amounts for subscriptions currently being paid and explicitly excludes free plans and metered usage-based products, as explained in this subscription revenue attribution reference.
That distinction should exist in your data model and your dashboard labels. Keep trial starts, active free accounts, paid subscriptions, and current MRR as separate measures. Otherwise, a successful signup campaign can appear to produce revenue before anyone has paid.
Net growth can hide churn
A positive net MRR change doesn't tell you whether the business acquired healthy customers. New MRR and expansion can offset churned and contraction MRR. If you review only the net figure, you may miss a cohort that is losing revenue while older accounts expand.
Use a movement view that shows:
- New revenue: First-time paying customers.
- Expansion: Existing customers paying more.
- Contraction: Existing customers paying less.
- Churn: Customers no longer contributing recurring revenue.
Finally, don't treat a billing event as a customer explanation. A downgrade is observable. The reason behind it may require interviews, cancellation surveys, support history, or product research. Keep those evidence types separate so your analytics stays credible.
Your Next Steps for Better Analytics
Start with a short audit rather than a large implementation.
- Review your UTM setup: Check that campaign sources are consistent and preserved through signup.
- Choose a stable account identity: Make sure the signup record can be matched to the Stripe or Paddle customer.
- Define paid revenue clearly: Separate trials and free plans from currently paid subscriptions.
- Build the MRR movement view: Report new, expansion, contraction, and churned MRR separately.
- Ask source-level questions: Compare paying customers, current MRR, and retention by acquisition source and cohort.
- Review the funnel regularly: Investigate the stage where qualified accounts stop progressing, not just the stage with the largest raw volume.
The aim isn't to collect more events. It's to connect the events you already have well enough to decide which marketing sources bring durable subscription revenue and where customer value is being lost.
Chartsy connects website and signup sources with Stripe and Paddle subscription data, helping small SaaS teams analyze paying customers, MRR, churn, and subscription movements in one workflow. Visit Chartsy to explore a practical way to replace disconnected funnel reports with revenue-linked attribution.

Written by
Chartsy TeamAnalytics team at Chartsy
The Chartsy Team writes guides, product updates, and resources to help SaaS and eCommerce founders make sense of their metrics, without SQL or spreadsheets.
Chartsy